A treemap represent an entity of items in a rectangle where each item occupies a rectangle and all entities are inside the single rectangle( not unlike a map of a state containing all the counties, a map unlike treemap is not in a rectangle).

This is supported visualization type in Power BI.

Treemap.png
I am using the data from this post of filtered sales by employees in the Northwind database on SQL Server 2016 using a direct query.
On a new page, click treemap under visualization to add the treemap to the page as shown,

Treemap_0
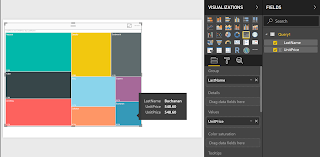
Drag fields LastName and UnitPrice to the treemap and the treemap changes as shown. Each rectangle now corresponds to an employee with its area in proportion to the sales made by the employee.

You can add other formatting as shown

Treemap_000
You can add Spotlight to the treemap using the Spotlight menu as shown.

Treemap_2
You can also add tooltip in the Group page.
Treemap_3

This is supported visualization type in Power BI.

Treemap.png
I am using the data from this post of filtered sales by employees in the Northwind database on SQL Server 2016 using a direct query.
On a new page, click treemap under visualization to add the treemap to the page as shown,

Treemap_0
Drag fields LastName and UnitPrice to the treemap and the treemap changes as shown. Each rectangle now corresponds to an employee with its area in proportion to the sales made by the employee.

Treemap_00
You can add other formatting as shown

Treemap_000
You can add Spotlight to the treemap using the Spotlight menu as shown.

Treemap_2
You can also add tooltip in the Group page.

Treemap_3
No comments:
Post a Comment