Even if you've never played, you've likely seen a Sudoku puzzle. At its core, Sudoku is a logic-based number placement puzzle set on a 9x9 grid. The grid is further divided into nine 3x3 smaller squares. To solve it, you simply need to place numbers from 1 to 9 into the empty cells. The catch? Each number can only appear once in each row, once in each column, and once in each of the nine 3x3 blocks. It's an addictive challenge that relies solely on deduction. For an in-depth look at its origins and variations, check out its Wikipedia page.
Now that you understand the game, this post will take you behind the scenes. We'll provide the complete Python code for building your own Sudoku puzzle generator and solver, followed by a step-by-step annotation of how it all works.
This code was run on PyCharm and there are a number of posts in this blog for you to get acquainted. Here is the complete code that you could copy and paste.
from kivy.app import App
from kivy.uix.gridlayout import GridLayout
from kivy.uix.boxlayout import BoxLayout
from kivy.uix.button import Button
from kivy.uix.label import Label
from kivy.uix.textinput import TextInput
from kivy.properties import ListProperty, ObjectProperty, StringProperty
from kivy.graphics import Color, Line
from kivy.lang import Builder
import random
import time


class Sudoku(object):
    def __init__(self, size=9):
        self.size = size
        self.grid = [[0 for _ in range(size)] for _ in range(size)]
        self.original_grid = None
        self.original_solution = None

    def generate_puzzle(self, difficulty):
        self._solve()
        self.original_solution = [row[:] for row in self.grid]

        squares_to_remove = 0
        if difficulty == "easy":
            squares_to_remove = 45
        elif difficulty == "medium":
            squares_to_remove = 55
        elif difficulty == "hard":
            squares_to_remove = 65

        self.grid = [row[:] for row in self.original_solution]
        cells = list((r, c) for r in range(self.size) for c in range(self.size))
        random.shuffle(cells)

        removed_count = 0
        for r, c in cells:
            if self.grid[r][c] != 0:
                temp = self.grid[r][c]
                self.grid[r][c] = 0
                if not self._has_unique_solution(self.grid):
                    self.grid[r][c] = temp
                else:
                    removed_count += 1
                    if removed_count >= squares_to_remove:
                        break
        self.original_grid = [row[:] for row in self.grid]  # Corrected line

    def _solve(self):
        find = self._find_empty()
        if not find:
            return True
        else:
            row, col = find

        for num in range(1, self.size + 1):
            if self._is_valid(row, col, num):
                self.grid[row][col] = num
                if self._solve():
                    return True
                self.grid[row][col] = 0
        return False

    def _find_empty(self):
        for i in range(self.size):
            for j in range(self.size):
                if self.grid[i][j] == 0:
                    return i, j
        return None

    def _is_valid(self, row, col, num):
        if num in self.grid[row]:
            return False
        if num in [self.grid[i][col] for i in range(self.size)]:
            return False
        start_row, start_col = 3 * (row // 3), 3 * (col // 3)
        for i in range(3):
            for j in range(3):
                if self.grid[start_row + i][start_col + j] == num:
                    return False
        return True

    def _find_all_solutions(self, current_grid):
        solutions = []

        def solve_recursive(grid, solutions):
            find = self._find_empty_in_grid(grid)
            if not find:
                solutions.append([row[:] for row in grid])
                return
            row, col = find
            for num in range(1, self.size + 1):
                if self._is_valid_in_grid(grid, row, col, num):
                    grid[row][col] = num
                    solve_recursive(grid, solutions)
                    if len(solutions) > 1:
                        return
                    grid[row][col] = 0

        solve_recursive(current_grid, solutions)
        return solutions

    def _has_unique_solution(self, puzzle_grid):
        solutions = self._find_all_solutions([row[:] for row in puzzle_grid])
        return len(solutions) == 1

    def _find_empty_in_grid(self, grid):
        size = len(grid)
        for i in range(size):
            for j in range(size):
                if grid[i][j] == 0:
                    return i, j
        return None

    def _is_valid_in_grid(self, grid, row, col, num):
        size = len(grid)
        if num in grid[row]:
            return False
        if num in [grid[i][col] for i in range(size)]:
            return False
        start_row, start_col = 3 * (row // 3), 3 * (col // 3)
        for i in range(3):
            for j in range(3):
                if grid[start_row + i][start_col + j] == num:
                    return False
        return True

    def is_complete(self):
        for row in self.grid:
            if 0 in row or len(set(row)) != self.size:
                return False
        for col in range(self.size):
            if len(set(self.grid[i][col] for i in range(self.size))) != self.size:
                return False
        for i in range(0, self.size, 3):
            for j in range(0, self.size, 3):
                block = [self.grid[row][col] for row in range(i, i + 3) for col in range(j, j + 3)]
                if len(set(block)) != 9:
                    return False
        return True


class SudokuCell(TextInput):
    def __init__(self, **kwargs):
        super(SudokuCell, self).__init__(**kwargs)
        self.multiline = False
        self.input_filter = 'int'
        self.halign = 'center'
        self.valign = 'middle'
        self.font_size = 40
        self.foreground_color = (0, 0, 0, 1)
        self.bind(focus=self.on_focus)  # Added self.on_focus

    def on_text(self, instance, value):
        if len(value) > 1:
            self.text = value[-1]
        if value and not (1 <= int(value) <= 9):
            self.text = ""

    def on_focus(self, instance, focused):  # Added this method
        if self.parent:
            self.parent.on_cell_focus(self, focused)


class SudokuBlock(GridLayout):
    """
    Represents a 3x3 sub-grid within the Sudoku grid.
    """
    block_row = ObjectProperty(None)  # 0, 1, or 2
    block_col = ObjectProperty(None)  # 0, 1, or 2
    cells = ListProperty([])

    def __init__(self, **kwargs):
        super().__init__(cols=3, rows=3, **kwargs)
        self.block_row = kwargs.get('block_row', 0)  # Get block row and col
        self.block_col = kwargs.get('block_col', 0)
        self.cells = []
        for i in range(3):
            for j in range(3):
                cell = SudokuCell()
                cell.row = self.block_row * 3 + i
                cell.col = self.block_col * 3 + j
                # cell.bind(focus=self.on_cell_focus) # Removed this line
                self.add_widget(cell)
                self.cells.append(cell)

    def get_block_values(self):
        """Returns the values of the cells in this block."""
        values = []
        for cell in self.cells:
            text = cell.text
            if text.isdigit():
                values.append(int(text))
            else:
                values.append(0)
        return values

    def set_block_values(self, values):
        """Sets the values of the cells in this block."""
        if len(values) != 9:
            raise ValueError("Must provide 9 values for a 3x3 block")
        for i, cell in enumerate(self.cells):
            cell.text = str(values[i]) if values[i] != 0 else ""


class SudokuGrid(GridLayout):
    grid_data = ListProperty([[0 for _ in range(9)] for _ in range(9)])
    selected_cell = ObjectProperty(None)
    blocks = ListProperty([])
    block_line_color = ListProperty([0, 0, 0, 1])  # Default to black

    def __init__(self, **kwargs):
        super().__init__(cols=3, rows=3, **kwargs)  # 3x3 grid of blocks
        self.blocks = []
        self.block_line_color = kwargs.get('block_line_color', [0, 0, 0, 1])
        for i in range(3):
            block_row_list = []
            for j in range(3):
                block = SudokuBlock(block_row=i, block_col=j)
                self.add_widget(block)
                block_row_list.append(block)
            self.blocks.append(block_row_list)
        self.bind(size=self.on_size, pos=self.on_size)
        self.on_size()

    def on_size(self, *args):
        self.draw_grid()

    def on_grid_data(self, instance, value):
        for i in range(9):
            for j in range(9):
                block_row = i // 3
                block_col = j // 3
                cell_index_in_block = (i % 3) * 3 + (j % 3)
                self.blocks[block_row][block_col].cells[cell_index_in_block].text = str(value[i][j]) if value[i][
                                                                                            j] != 0 else ""                                                                                      j] != 0 else ""

    def get_grid_values(self):
        values = [[0 for _ in range(9)] for _ in range(9)]
        for i in range(9):
            for j in range(9):
                block_row = i // 3
                block_col = j // 3
                cell_index_in_block = (i % 3) * 3 + (j % 3)
                text = self.blocks[block_row][block_col].cells[cell_index_in_block].text
                if text.isdigit():
                    values[i][j] = int(text)
                else:
                    values[i][j] = 0
        return values

    def on_cell_focus(self, instance, focused):
        """Handles cell focus and stores the selected cell"""
        if focused:
            self.selected_cell = (instance.row, instance.col)
        else:
            if self.selected_cell == (instance.row, instance.col):
                self.selected_cell = None

    def draw_grid(self, *args):
        self.canvas.before.clear()
        size = min(self.width, self.height)
        block_size = size / 3
        grid_x, grid_y = self.pos
        with self.canvas.before:
            Color(*self.block_line_color)  # Use the block_line_color
            for i in range(4):
                line_width = 3
                x1 = grid_x + i * block_size
                y1 = grid_y
                x2 = grid_x + i * block_size
                y2 = grid_y + size
                Line(points=[x1, y1, x2, y2], width=line_width)

                x1 = grid_x
                y1 = grid_y + i * block_size
                x2 = grid_x + size
                y2 = grid_y + i * block_size
                Line(points=[x1, y1, x2, y2], width=line_width)


class SudokuCreatorApp(App):
    grid_widget = ObjectProperty(None)
    message = StringProperty("")

    def build(self):
        main_layout = BoxLayout(orientation='vertical')
        # Pass the color to the grid widget
        self.grid_widget = SudokuGrid(block_line_color=[1, 0, 0, 1])
# Example: Red color
        main_layout.add_widget(self.grid_widget)

        button_layout = BoxLayout(size_hint_y=None, height=50)
        generate_easy_button = Button(text="Generate Easy", on_press=lambda btn: self.generate_puzzle("easy"))
        generate_medium_button = Button(text="Generate Medium", on_press=lambda btn: self.generate_puzzle("medium"))
        generate_hard_button = Button(text="Generate Hard", on_press=lambda btn: self.generate_puzzle("hard"))
        check_button = Button(text="Check", on_press=self.check_puzzle)
        solve_button = Button(text="Solve", on_press=self.solve_puzzle)
        clear_button = Button(text="Clear", on_press=self.clear_grid)

        button_layout.add_widget(generate_easy_button)
        button_layout.add_widget(generate_medium_button)
        button_layout.add_widget(generate_hard_button)
        button_layout.add_widget(check_button)
        button_layout.add_widget(solve_button)
        button_layout.add_widget(clear_button)

        message_label = Label(text=self.message, size_hint_y=None, height=30)

        main_layout.add_widget(button_layout)
        main_layout.add_widget(message_label)

        return main_layout

    def generate_puzzle(self, difficulty):
        sudoku = Sudoku()
        sudoku.generate_puzzle(difficulty)
        self.grid_widget.grid_data = sudoku.grid
        self.message = f"Generated {difficulty} puzzle."

    def check_puzzle(self, event):
        current_grid = self.grid_widget.get_grid_values()
        sudoku = Sudoku()
        sudoku.grid = current_grid
        if sudoku.is_complete():
            self.message = "Sudoku is complete and valid!"
        else:
            self.message = "Sudoku is not complete or contains errors."

    def solve_puzzle(self, event):
        current_grid = self.grid_widget.get_grid_values()
        sudoku = Sudoku()
        sudoku.grid = [row[:] for row in current_grid]
        if sudoku._solve():
            self.grid_widget.grid_data = sudoku.grid
            self.message = "Puzzle solved!"
        else:
            self.message = "This puzzle has no solution."

    def clear_grid(self, event):
        self.grid_widget.grid_data = [[0 for _ in range(9)] for _ in range(9)]
        self.message = "Grid cleared."


if __name__ == '__main__':
    SudokuCreatorApp().run()
The code is long and should you be wanting some explanation, it is here:
You've created a fascinating Sudoku puzzle maker! Let's break down your code step-by-step to understand how each part contributes to the overall application.
1. Importing Libraries
At the beginning of your code, you import all the necessary modules:
- Kivy Modules: These are the core components for building your graphical user interface (GUI).
kivy.app.App: The base class for all Kivy applications.kivy.uix.gridlayout.GridLayout: Arranges widgets in a grid.kivy.uix.boxlayout.BoxLayout: Arranges widgets in a box, either horizontally or vertically.kivy.uix.button.Button: Creates interactive buttons.kivy.uix.label.Label: Displays static text.kivy.uix.textinput.TextInput: Allows users to input text (for the Sudoku cells).kivy.properties.ListProperty, ObjectProperty, StringProperty: These are Kivy properties used for data binding and making attributes observable.kivy.graphics.Color, kivy.graphics.Line: Used for drawing shapes and lines on the canvas, specifically for the Sudoku grid lines.kivy.lang.Builder: Allows you to load Kivy language (KV) files, although you're not explicitly using a KV file in this specific code.
- Standard Python Modules:
random: Used for generating random numbers, crucial for shuffling cells during puzzle generation.time: Although imported, it's not explicitly used in the provided code snippet. It could be used for timing operations, if needed.
2. Sudoku Logic (Sudoku Class)
This class encapsulates all the backend logic for generating, solving, and validating Sudoku puzzles.
__init__(self, size=9):
- Initializes a
Sudoku object with a given size (defaulting to 9x9).
self.grid: Represents the current state of the Sudoku grid, initialized with zeros.self.original_grid: Stores the puzzle as it was originally generated (with empty cells).self.original_solution: Stores the complete, solved grid that was used to create the puzzle.
generate_puzzle(self, difficulty):
- This is the heart of your puzzle creation.
- It first calls
self._solve() to create a completely filled (solved) Sudoku grid.
self.original_solution is then set to this newly solved grid.- Based on the
difficulty ("easy", "medium", "hard"), it determines how many squares_to_remove (i.e., how many cells to clear) from the solved grid.
- It shuffles a list of all cell coordinates (
cells).
- It then iterates through the shuffled cells:
- It temporarily removes a number from a cell.
- It calls
self._has_unique_solution() to check if the puzzle still has only one solution after removing the number.
- If it doesn't have a unique solution, the number is put back.
- If it does have a unique solution, the removal is kept, and
removed_count is incremented.
- This process stops once enough squares have been removed for the chosen difficulty.
- Finally,
self.original_grid is set to the puzzle state after removing cells.
_solve(self):
- This is a recursive backtracking algorithm to solve the Sudoku grid.
- It finds the next empty cell using
self._find_empty(). If no empty cells are found, the puzzle is solved, and it returns True.
- For each number from 1 to 9, it checks if placing that number in the empty cell is
_is_valid().
- If valid, it places the number and recursively calls
_solve() again.
- If the recursive call returns
True (meaning a solution was found), it propagates True back up.
- If the recursive call returns
False (meaning that number didn't lead to a solution), it backtracks by setting the cell back to 0.
_find_empty(self):
- Iterates through the
self.grid to find the first cell with a value of 0 (empty).
- Returns the
(row, col) of the empty cell or None if no empty cells are found.
_is_valid(self, row, col, num):
- Checks if placing
num at (row, col) is valid according to Sudoku rules.
- It verifies:
- No duplicate
num in the row.
- No duplicate
num in the col.
- No duplicate
num in the 3x3 block that contains (row, col).
_find_all_solutions(self, current_grid):
- This function is crucial for ensuring the generated puzzle has a unique solution.
- It uses a nested
solve_recursive helper function, similar to _solve, but designed to find all possible solutions.
- It stops searching for solutions as soon as more than one solution is found to optimize performance (
if len(solutions) > 1: return).
_has_unique_solution(self, puzzle_grid):
- Takes a
puzzle_grid (which might have empty cells).
- Calls
_find_all_solutions() on a copy of the puzzle_grid.
- Returns
True if len(solutions) is exactly 1, indicating a unique solution.
_find_empty_in_grid(self, grid):
- Similar to
_find_empty, but operates on an arbitrary grid passed as an argument.
_is_valid_in_grid(self, grid, row, col, num):
- Similar to
_is_valid, but operates on an arbitrary grid passed as an argument.
is_complete(self):
- Checks if the current
self.grid represents a complete and valid Sudoku solution.
- It verifies:
- No zeros (empty cells) in any row.
- All rows contain unique numbers from 1 to 9.
- All columns contain unique numbers from 1 to 9.
- All 3x3 blocks contain unique numbers from 1 to 9.
3. Sudoku Cell (SudokuCell Class)
This Kivy widget represents a single input cell in the Sudoku grid.
__init__(self, **kwargs):
- Initializes the
TextInput properties:
multiline = False: Ensures only single-line input.input_filter = 'int': Allows only integer input.halign = 'center', valign = 'middle': Centers the text horizontally and vertically.font_size = 40: Sets a large font size for readability.foreground_color = (0, 0, 0, 1): Sets text color to black.
self.bind(focus=self.on_focus): Binds the on_focus event to the on_focus method, allowing the parent to track which cell is selected.
on_text(self, instance, value):
- This method is called whenever the text in the
TextInput changes.
- It ensures that only the last character entered is kept if the user types multiple characters quickly.
- It also clears the text if the entered value is not between 1 and 9.
on_focus(self, instance, focused):
- This method is called when the cell gains or loses focus.
- It calls the
on_cell_focus method of its parent (the SudokuBlock), passing itself and the focus status.
4. Sudoku Block (SudokuBlock Class)
This Kivy widget represents a 3x3 sub-grid of Sudoku cells.
block_row, block_col: Kivy ObjectProperty to store the row and column index of the block within the larger 3x3 grid of blocks (e.g., top-left block is block_row=0, block_col=0).cells: Kivy ListProperty to hold references to the nine SudokuCell instances within this block.__init__(self, **kwargs):
- Initializes a
GridLayout with 3 columns and 3 rows.
- It sets
block_row and block_col from the passed keyword arguments.
- It creates nine
SudokuCell instances, assigns their absolute row and col values within the 9x9 grid, adds them to the block's layout, and stores them in self.cells.
get_block_values(self):
- Retrieves the current numerical values (or 0 for empty) from all cells within this block and returns them as a list.
set_block_values(self, values):
- Takes a list of 9 values and updates the text of the cells in the block accordingly. An empty string is used for 0 to represent an empty cell.
5. Sudoku Grid (SudokuGrid Class)
This Kivy widget represents the entire 9x9 Sudoku grid, composed of nine SudokuBlock instances.
grid_data: Kivy ListProperty to hold the 2D list representing the Sudoku puzzle data. When this property changes, the Kivy framework automatically updates the UI.selected_cell: Kivy ObjectProperty to store the (row, col) of the currently focused cell.blocks: Kivy ListProperty to hold a 2D list of SudokuBlock instances.block_line_color: Kivy ListProperty to define the color of the major 3x3 block lines.__init__(self, **kwargs):
- Initializes as a
GridLayout with 3 columns and 3 rows (to hold the SudokuBlock instances).
- It creates nine
SudokuBlock instances, arranging them in a 3x3 grid, and adds them as widgets.
- It binds the
size and pos properties to on_size to redraw grid lines when the widget is resized or moved.
on_size(self, *args):
- Called when the size or position of the
SudokuGrid changes.
- It triggers
self.draw_grid() to redraw the grid lines.
on_grid_data(self, instance, value):
- This is a Kivy property observer method. Whenever
grid_data is updated, this method is called.
- It iterates through the 9x9 value (the new grid data) and updates the text property of the corresponding
SudokuCell widgets.
get_grid_values(self):
- Retrieves the current numerical values (or 0 for empty) from all
SudokuCell widgets in the entire 9x9 grid and returns them as a 2D list.
on_cell_focus(self, instance, focused):
- This method is called by a
SudokuCell (via its SudokuBlock parent) when its focus state changes.
- It updates
self.selected_cell to the (row, col) of the focused cell or None if focus is lost.
draw_grid(self, *args):
- This method uses Kivy's graphics instructions to draw the thick lines that delineate the 3x3 blocks.
- It clears previous drawings (
self.canvas.before.clear()).
- It uses
Color(*self.block_line_color) to set the drawing color.
- It draws four vertical and four horizontal lines with a specified
line_width to create the block boundaries.
6. Sudoku Application (SudokuCreatorApp Class)
This is the main Kivy application class that brings everything together.
grid_widget: Kivy ObjectProperty to hold the instance of SudokuGrid.message: Kivy StringProperty to display messages to the user (e.g., "Generated Easy puzzle.").build(self):
- This method is called by Kivy to construct the application's user interface.
- It sets up a
BoxLayout as the main_layout with vertical orientation.
- It creates an instance of
SudokuGrid (self.grid_widget) and adds it to the main_layout, passing a red color for the block lines.
- It creates another
BoxLayout for the buttons (button_layout).
- It creates "Generate Easy", "Generate Medium", "Generate Hard", "Check", "Solve", and "Clear" buttons, each with an
on_press event handler that calls the appropriate method.
- It adds a
Label to display the message to the user.
- Finally, it adds the
button_layout and message_label to the main_layout.
- It returns the
main_layout which becomes the root widget of the application.
generate_puzzle(self, difficulty):
- Creates a
Sudoku object.
- Calls the
sudoku.generate_puzzle() method with the specified difficulty.
- Updates
self.grid_widget.grid_data with the generated puzzle, which automatically updates the UI.
- Updates the
self.message label.
check_puzzle(self, event):
- Retrieves the current grid values from the
grid_widget.
- Creates a
Sudoku object and sets its grid to the current user input.
- Calls
sudoku.is_complete() to check the validity and completeness.
- Updates the
self.message label based on the result.
solve_puzzle(self, event):
- Retrieves the current grid values from the
grid_widget.
- Creates a
Sudoku object and sets its grid.
- Calls
sudoku._solve() to find a solution.
- If a solution is found, it updates
self.grid_widget.grid_data with the solved grid.
- Updates the
self.message label.
clear_grid(self, event):
- Resets
self.grid_widget.grid_data to an empty 9x9 grid of zeros, effectively clearing the UI.
- Updates the
self.message label.
7. Application Entry Point (if __name__ == '__main__':)
This standard Python construct ensures that SudokuCreatorApp().run() is called only when the script is executed directly (not when it's imported as a module).
SudokuCreatorApp().run(): Starts the Kivy application event loop, displaying the GUI.
Running the code:
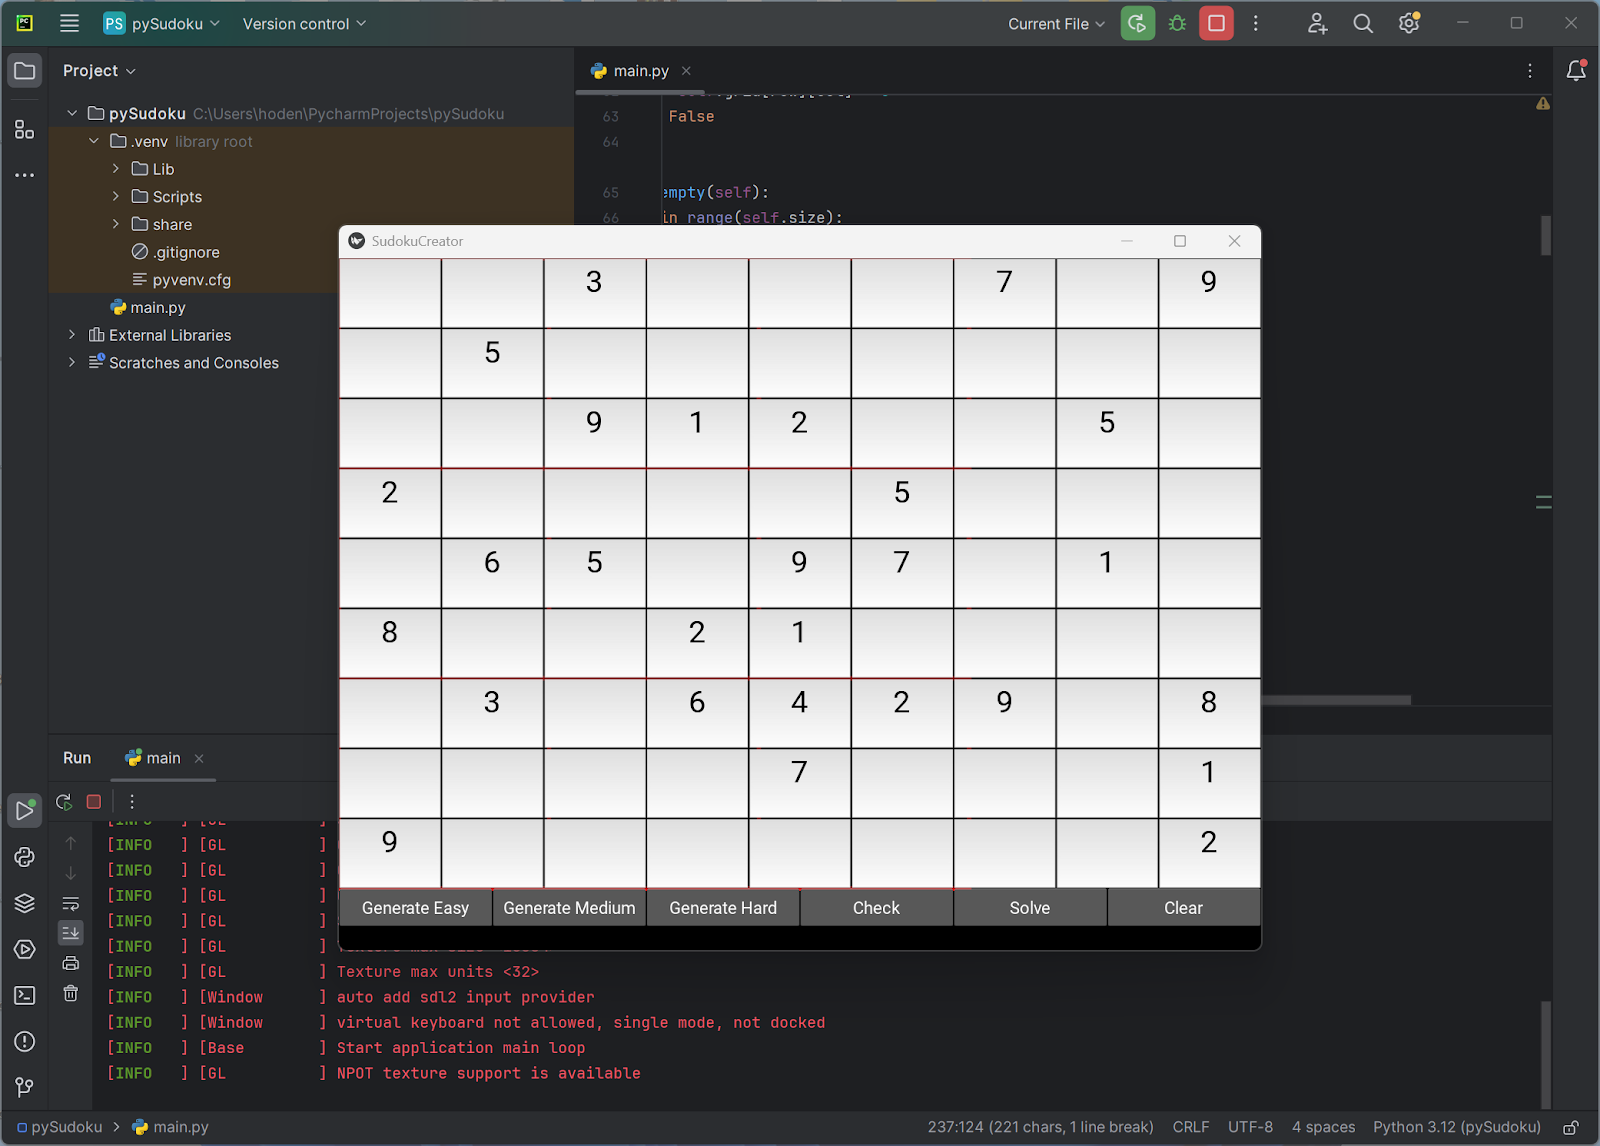
The result of running the code is an empty Sudoku grid with 4 buttons at the bottom with their functionality as their names.
When you click Generate Hard this is displayed. This populates only a couple of cells in the grid leading to a 'hard' to solve problem.
When you hit Solve in the generated grid, this will be displayed.

The game is still under testing and development.
 The set up for R on Windows needs to be selected:
 Rforwindows08
 R_helpstart.png