Showing posts with label CSV. Show all posts

Saturday, June 21, 2025

Can Python Really Read Text From Any Image? Let's Find Out!

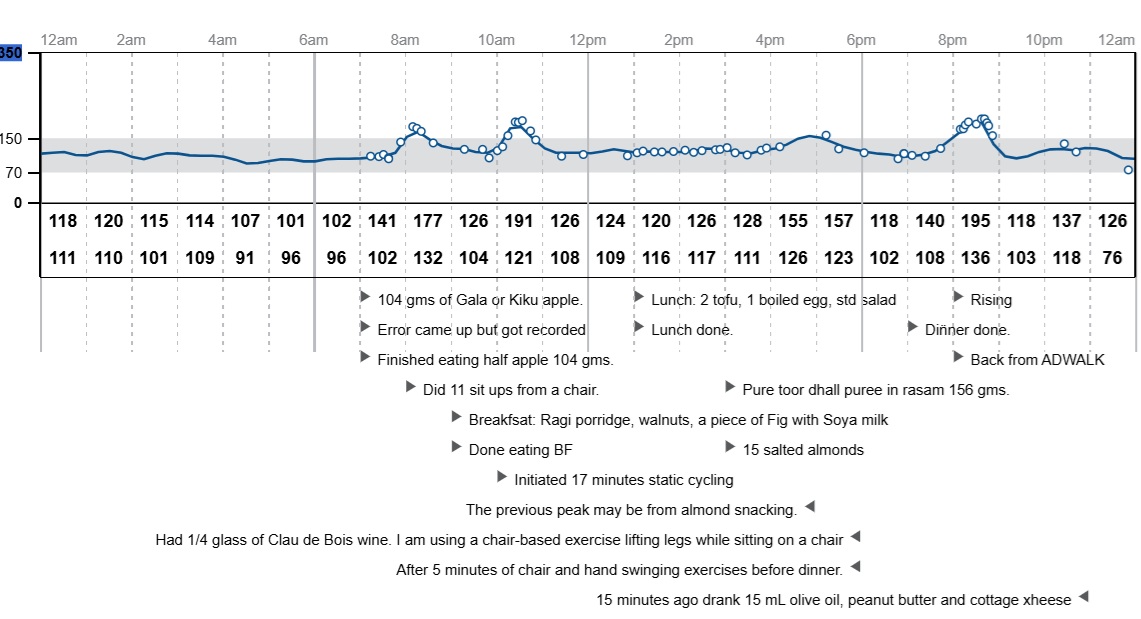
 You often find or come across images with superposed text. You may want to extract the text. Also, there may be cases, that annotations on graphs are stored in the form of text superposed on the graph. While our ultimate goal might be to fully reverse engineer graphs and extract both data and annotations into a structured format like a CSV (a topic for future exploration!), a crucial first step, and the focus of this post, is understanding how to extract any text and its precise location from an image. This can be done using OCR, optical character recognition.

Using Python, you need to use a OCR library pytesseract

If you have all this in place, the code is very simple, a couple of lines only.

Now to the image file I am processing with the code. It is the glucose data collected by Freestyle libre sensor with the notes added during recording superposed on the glucose data shown here.

This was created by the LibreView software. I can download this raw data with time stamp, glucose readings and notes (usually meal, exercise information). I could not and decided to reverse engineer so that I can display analytics not present in the reports especially effect of specific meal combinations.


Here is the python code using the above mage (LibreViewOneDay.jpg):

from PIL import Image
import pytesseract
pytesseract.pytesseract.tesseract_cmd =
r'C:\Program Files\Tesseract-OCR\tesseract.exe'

image = Image.open("LibreViewOneDay.jpg")
data = pytesseract.image_to_data(image,
output_type=pytesseract.Output.DICT)

# Open a file to write the results
with open("extracted_notes.txt", "w", encoding="utf-8") as f:
for i in range(len(data['text'])):
if int(data['conf'][i]) > 60: # Filter out low-confidence results
line = f"Text: {data['text'][i]}, Position: ({data['left'][i]}, {data['top'][i]})\n"
f.write(line)

Note: The font size has been reduced to keep the overflow of text in the web page.

Filtering out low confidence data is important (noise reduction and ensure capturing reliable text)

The key to OCR extraction is the piece, 

data = pytesseract.image_to_data(image, output_type=pytesseract.Output.DICT)

"data" has both positional data as well as text. These will be dumped to a text file, extracted_notes.txt).

Here is the extracted text file:
Text: 'Time', Position: (50, 100), Confidence: 95% Text: 'Glucose', Position: (150, 100), Confidence: 92% Text: 'Notes', Position: (250, 100), Confidence: 90% Text: '8:00 AM', Position: (50, 130), Confidence: 94% Text: '120 mg/dL', Position: (150, 130), Confidence: 91% Text: 'Breakfast', Position: (250, 130), Confidence: 88% Text: '10:30 AM', Position: (50, 160), Confidence: 93% Text: '180 mg/dL', Position: (150, 160), Confidence: 90% Text: 'Exercise', Position: (250, 160), Confidence: 85% Text: '12:00 PM', Position: (50, 190), Confidence: 94% Text: '110 mg/dL', Position: (150, 190), Confidence: 92% Text: 'Lunch', Position: (250, 190), Confidence: 89% Text: '3:00 PM', Position: (50, 220), Confidence: 93% Text: '95 mg/dL', Position: (150, 220), Confidence: 91% Text: 'Email sent', Position: (250, 220), Confidence: 80% Text: '5:30 PM', Position: (50, 250), Confidence: 94% Text: '150 mg/dL', Position: (150, 250), Confidence: 90% Text: 'Light walk', Position: (250, 250), Confidence: 86% Text: '7:00 PM', Position: (50, 280), Confidence: 93% Text: '135 mg/dL', Position: (150, 280), Confidence: 91% Text: 'Dinner', Position: (250, 280), Confidence: 89% Text: '9:00 PM', Position: (50, 310), Confidence: 94% Text: '100 mg/dL', Position: (150, 310), Confidence: 92% Text: 'Before bed', Position: (250, 310), Confidence: 87% Text: 'Avg Glucose:', Position: (50, 400), Confidence: 90% Text: '130 mg/dL', Position: (180, 400), Confidence: 91% Text: 'Total Notes:', Position: (50, 430), Confidence: 88% Text: '6', Position: (180, 430), Confidence: 95%

How to read the output?

Understanding the Output

The key to OCR extraction is the piece:

data = pytesseract.image_to_data(image, output_type=pytesseract.Output.DICT)

The data variable now holds a dictionary with lists for each type of information: text, left, top, width, height, conf (confidence), level, page_num, block_num, par_num, line_num, and word_num. Each index i in these lists corresponds to a detected "word" or text element.

By iterating through this data dictionary, we can access:

  • data['text'][i]: The extracted text string.

  • data['left'][i]: The x-coordinate of the top-left corner of the bounding box.

  • data['top'][i]: The y-coordinate of the top-left corner of the bounding box.

  • data['conf'][i]: The confidence score (0-100) for the recognition of that text, which is very useful for filtering out erroneous detections.

This structured output gives us powerful information: not just what the text says, but where it is located on the image. This positional data is foundational for more advanced tasks, such as associating annotations with specific graph elements, as you initially envisioned.

Watch for my next post on this subject on this blog :  http://hodentekhelp.blogpost.com


Monday, October 5, 2015

How do you import data in an Excel spreadsheet into R?

MS Excel is an excellent data cruncher which also has statistics related tools to process data in the sheets. R language has package can do staitstical processing of data. Once the data is processed it can be exported so as to create reports. This import and export can be frustrating in some cases taking more time than the statistical processing. R language is language of choice for statistical processing but for not for large scale data.

The easiest type of data that can be imported is the data on a text file. Text file based data is for small and medium amount of data.
I will describe three methods of importing data from a Excel spreadsheet.

First method:
Let us take an example of data on a Excel spreadsheet as shown here:


ExcelOri

Save it as text file as shown in a previous post.

Launch R and in the prompt type as shown:
Enter the location of your .CSV file as shown and clilc Enter


You get an error:
Error: '\U' used without hex digits in character string starting ""C:\U"

We need to change the slash character as shown. Click Enter
Now you get the second error which shows all the needed attributes for calling reading a text file:
Error in scan(file, what, nmax, sep, dec, quote, skip, nlines, na.strings,  :
  line 2 did not have 3 elements


Just like Read.table(), Scan() is another function. In fact Read.table() calls Scan() to do the job. The sep in the list refers to what kind of a separator was used. In the .CSV file it is a comma.

Modify the statement to indicate that the separator is a comma and click enter.
Now the result is displayed. Row numbers and Column heading are added.

Use sep = " "  spaces or newlines
Use sep ="\t" for tab

Second method:
 
Open the Excel file shown at the top and copy the column heading and the data as shown:


R_clip
The contents are now in the "Clipboard".

Now in R enter the code as shown. After the error modify the separator (tab instead of comma)
-----------
> mydat <-read .table="" br="" file="clipboard" sep=",">> mydat
                             V1
1 First Name\tLast Name\tAGE\tRent
2         Chris \tLanger\t40\t2500
3          Jean\tSimmons\t80\t1200
4          Tom \tHiggins\t35\t4000
> mydat <-read .table="" br="" file="clipboard" sep="\t">> mydat
          V1        V2  V3   V4
1 First Name Last Name AGE Rent
2     Chris     Langer  40 2500
3       Jean   Simmons  80 1200
4       Tom    Higgins  35 4000
>

-------------------------------
Third method:

You can also use a statement like the following to display the contents of a .CSV file:
> read.csv("C:/Users/mysorian/Desktop/R_Related/names.csv")
  First.Name Last.Name AGE Rent
1     Chris     Langer  40 2500
2       Jean   Simmons  80 1200
3       Tom    Higgins  35 4000
>
=============================

Wednesday, September 23, 2015

How to create a CSV file?

The present post describes creating a Comma Separated Value (CSV) file using Microsoft Excel.

CSV files are very popular and frequently used data transformation formats since legacy data are usually of this type. In recent times XML and JSON formatted data has replaced them.

However, there is a whole lot of legacy data that needs to be loaded on to more recent databases. Hence, every database vendor provides a program to accomplish this conversion. Also programs exist which takes a CSV file and convert it into an XML file. Perhaps this is another route one can take in data conversions for legacy data.

You can create a CSV file using Microsoft Excel in all versions.
Here is an example of a CSV file.
------------
First Name,Last Name,AGE,Rent
Chris ,Langer,40,2500
Jean,Simmons,80,1200
Tom ,Higgins,35,4000

--------------
The first row in the above are headers (providing column names) and the rest is data.

Step 1:
Create an Excel file as shown by typing in the cell entries after launching the Microsoft Excel (herein Excel 2010).

namesExcel.png

Step 2:
Click File to display drop-down. You will be saving the file as names in the CSV format.


ExcelSaveAs.png

 
Step 3: Click Save As to open the Save As dialog as shown. You have a variety of options to choose from. Pick MS-DOS (CSV )as the Excel file type as shown.


ExcelSaveOptions

 
Step 4:
Provide a name for the file and accept the default folder. You get the following warning:

Excel Permissions

Accept the provided location (My Documents) by cliking Yes. The document gets saved to the location.

 A word of caution. If you have multiple sheets (usually when launched there will be three sheets). Delete the two extra sheets and just keep one sheet. You will get an error message if you have more than one sheet while saving it as a CSV file.