Showing posts with label R Programming. Show all posts

Saturday, June 23, 2018

How do you mulitply two matrices in R?

The Matrix package need not be loaded as it is readily accessible in Microsoft R Client version 3.3 (x64).

Here are two matrices whose product will be calculated.


Here is the result of matrix mulitplication of two 2x2 matrices showing the procedure
to calculate the product.

MatrixMultiply_2.png

Here is how it is calculated using R. The syntax is (matrix1)%*%(matrix2) where both matrices are square matrices.


MatrixMulitply_3.png

You can multiply a n x m matrix with m x n matrix as shown here to get a n x n matrix.


MatrixMulitply_3.png
Here is an online matrix multiplier:

https://www.mathsisfun.com/algebra/matrix-calculator.html

Friday, June 22, 2018

How is the exponential function handled in R?

Exponential functions are very important in all branches of physics and mathematics. It is in fact taught in the very beginning when one learns mathematics.

In R programming exp(x) calculates,  'e to the power of x' where e is the Euler's constant.

Let us calculate the values of e raised to power of x, for x=0, 1, 10, and 100 using R.


How about exponential of negative numbers like, e raised to power of y, where y=-1,-10, and -100?

R can also be used to find expm1() which is defined as follows and should be used for small values of x instead of exp():

expm1(x)=exp(x)-1=(2*tanh(x/2))/(1-tanh(x/2))


For small x expm1() is better than exp() - 1


Friday, February 16, 2018

How do you change LongFormat to WideFormat in R programming?

In my previous post you must have seen the difference between WIDE and LONG formats and also learnt how to convert a WIDE formatted data to LONG format.

In this post, you will see the converting of LONG format to WIDE format.

In this case you need to use the spread() function.

Let us start with the LONG formatted data of the previous post.
------------------------------
   Day Segment condition measurement
    1      AM      Jack        2.30
    2      AM      Jack        3.50
    3      PM      Jack        2.50
    4      PM      Jack        3.00
    1      AM      Jane        3.51
    2      AM      Jane        4.20
    3      PM      Jane        3.90
    4      PM      Jane        4.00
    1      AM       Tom        1.70
    2      AM       Tom        3.90
    3      PM       Tom        2.10
    4      PM       Tom        2.50
---------------------------------------
At first, read LONG data using read.table().

LongtoWide1.png

Use this code to convert this to WIDE format:
<- condition="" data_long="" measurement="" p="" spread="">Before you use spread(), you should have the tidyr library as shown here:


<- condition="" data_long="" measurement="" p="" spread="">LongtoWide2.png
<- condition="" data_long="" measurement="" p="" spread="">
<- condition="" data_long="" measurement="" p="" spread="">Note: Both gather() and spread() takes considerable time to process.

Thursday, February 15, 2018

What is the difference between WIDE and LONG format in R Programming?

First of all look at the same data in WIDE and LONG formats:

This is data in WIDE format:

Day  Segment  Jack  Jane  Tom
1      AM          2.5    3.5     1.7
2      AM          3.5    4.2     3.9
3      PM           2.5    3.9     2.1
4      PM           3.0    4.0     2.5

The same data in LONG format:
   Day   Segment   condition   measurement
1    1      AM        Jack           2.30
2    2      AM        Jack           3.50
3    3      PM        Jack           2.50
4    4      PM         Jack          3.00
5    1      AM        Jane          3.51
6    2      AM       Jane           4.20
7    3      PM       Jane            3.90
8    4      PM       Jane            4.00
9    1      AM      Tom            1.70
10   2      AM       Tom          3.90
11   3      PM       Tom           2.10
12   4      PM       Tom           2.50

You can convert from WIDE to LONG format as shown here:

Read the WIDE data using read.table() as shown here:
-----------------------
> data_wide <-read .table="" br="" header="TRUE," text="<br>+ Day Segment  Jack  Jane  Tom <br>+ 1   AM       2.3   3.51  1.7<br>+ 2   AM       3.5   4.2   3.9<br>+ 3   PM       2.5   3.9   2.1<br>+ 4   PM       3.0   4.0   2.5 <br>+ ">> data_wide
  Day Segment Jack Jane Tom
1   1      AM  2.3 3.51 1.7
2   2      AM  3.5 4.20 3.9
3   3      PM  2.5 3.90 2.1
4   4      PM  3.0 4.00 2.5
---------------------------------

R_wideData.png

Now you need to use a function gather() to do this conversion. gather() is in the
package deplyr. I installed the package tidyr that installs deplyr from CRAN mirror here:
https://cran.cnr.berkeley.edu/bin/windows
-----------
Load the library
> library(dplyr)
--------
Now do the conversion:
--------
>  data_long <- br="" condition="" data_wide="" gather="" jack="" jane="" measurement="" tom="">> data_long
   Day Segment condition measurement
1    1      AM      Jack        2.30
2    2      AM      Jack        3.50
3    3      PM      Jack        2.50
4    4      PM      Jack        3.00
5    1      AM      Jane        3.51
6    2      AM      Jane        4.20
7    3      PM      Jane        3.90
8    4      PM      Jane        4.00
9    1      AM       Tom        1.70
10   2      AM       Tom        3.90
11   3      PM       Tom        2.10
12   4      PM       Tom        2.50
>

R_longData.png

Saturday, December 30, 2017

Show me how to write R Code for Hello World web page?

 R language is open source with a huge number of developers. It has a great arsenal of great stuff already accomplished. It is a language that you should get exposed to yourself. You just install R Gui and you are ready.


Shiny is an enterprise-grade web application framework targeted for those who want to develop with R using the familiar HTML5, CSS and JavaScript. Using R you can turn terrific analytic solutions you have developed/developing into interactive web applications.

Go to this site (https://shiny.rstudio.com/) directly and learn more.

 
Rshiny-00

If you have R Studio you have Shiny because Shiny is a package that you can download.

In this first part we only talk about the very basics.

I assume you have read my previous hands-on R examples in my blogs.


Here I just show a very basic (aka Hello World) example of creating content for a web page using R GUI. More will come later in my blogs.

Launch R Gui as shown and provide reference to the shiny "library" as shown by typing in the three lines of code (The four lines of code in red).


 HelloWorld_00

When you hit Enter after the third line where you define the shiny app, a browser window will open as shown displaying the apps output as shown at a port of the local host.


HelloWorld_01

You also get a response (the last line) in the R GUI as shown.


HelloWorld_02
That is all there is to create a content.

The ui summarizes your user interface, the server is something like a web server and shinyApp is your web response. No fuss, very simple.

Friday, December 22, 2017

What is tidyverse package?

Tidyverse.org defines itself as an 'opinionated collection of R Packages'. This is a modest statment as tidyverse can do a lot of things.

Tidyverse is specialized group of packages for data science.  If you are familair with ggplot2, the most popular data visualizing packgage in R universe, then it is included in tidyverse in addition to more useful packages.

The 'Core' package consists of many useful packages but you can also bring in others in the package to work with it to enhance its usability above and beyond what it can do by itself.

Here are what you find in the core of tidyverse.


These are loaded when you load tidyverse. There are packages in tidyverse that you have to load separately using the library() such as:
readxl .xls and .xlsx
haven for SPSS, Stata and SAS data
jsonlite
xml2
httr
rvest
DBI
and many others.

Tuesday, December 19, 2017

Can you import Arabic characters into a table using R?

I tried this simple example. I do not know Arabic but I created this 3x2 table and tried to get it into a variable in R. Looks like I succeeded. I think these are
Unicode (https://unicode-table.com/en/search/?q=U%2B0648) characters for the Arabic characters.

Now I request my Arabic readers to help me if this makes sense.


The first row translates to the following:


You may reply to: hodentek@live.com

How do I access individual table cells in a table.read() in R?

Once you have read data into R using table.read() as described here, you can also access each of the cells in the 9 element grid of the 3 columns X 3 rows by providing row and column numbers.

You defined the table as shown here:


You can access row1, column 1 using this code:
-----------
> df[1, "Col1"]
[1] A
-----------
Using code similar to the above you can access each element providing row number and column number as shown.

df[1, Col1]   df[1, "Col2"]   df[1, "Col3"]
df[2, Col1]   df[2, "Col2"]   df[2, "Col3"]
df[3, Col1]   df[3, "Col2"]   df[3, "Col3"]

Monday, December 18, 2017

How do you store the values of a table with three columns or more columns in R?

Let us say you want to work this table in R.
Table with three columns
Col1 Col2  Col3AA
A      50      40
B      70      60
C      25      75

In a previous post we described another way.

You can also directly assign the table using the tabel.read() as shown:

You could directly enter the text as shown:
--------------------
<- br="" header="TRUE," read.table="" text="<br>+ Col1   Col2   Col3<br>+ A      50     40<br>+ B      70     60<br>+ C      25     75<br>+ ">
--------------------
Note that while typing the text of your data, you need to put in the white spaces yourself. You cannot just copy the table shown earlier (Table with three columns) and paste it. The R Editor takes away the white spaces.
<- br="" header="TRUE," read.table="" text="<br>+ Col1   Col2   Col3<br>+ A      50     40<br>+ B      70     60<br>+ C      25     75<br>+ ">

Friday, December 15, 2017

How do I ‌put x and y values as data input in R programming?

In constructing relationship between x and y, we create a table with two columns, with x in the first column and corresponding y in the second column. The value of x may be discrete (numeric or non-numeric) or continuous(numeric) and y is numeric. A graph with x and y represents the table of values.
In the following there are six categories (A through F) and for each of these categories a value has been assigned (67,47,11,12,22,24). Now how do I create a data in R that I could work on?
This is easily carried out by creating a data frame as shown:

> dap <- br="" data.frame="">+  x=factor(c("A","B","C","D","E","F"), levels=c("A","B","C","D","E","F")),
+ ItmVal=c(69,47,11,12,42,24)
-----------------------------------


DataFrameDiscrete.png

Thursday, December 14, 2017

How do you use factor/s in R Programming?

Factors are variables to represent categories. Categories are discrete and not continuous. In statistics there is a need for such a variable.

Let us say, I roll the dice a dozen times and come up with values for each roll as shown:
2,4,5,3,2,6,10,5, 9,6,4,5

I can gather these in a data as shown in R with "dat":
data
---------------------------------


---------------------------------
Now I use 'factor' as used in R:
facData=factor(data)
--------------------

-----------------------
factor just took one unique item from the list presented to it to display in Levels. There were two 4's, three 5's and two 6's. It categorized them.

While the original data was numeric they could be also character data in "datac" below:


-------------------------------
We know the unique ones in the above data. How are we going to find how many of each are there?
For this we can use the table() in R as shown below:
------------------------------------

You can check for yourself, that it picked the correct value for each category.

Thursday, June 30, 2016

How do you install the XML library for R programming?

If you try to run the program to install the library for XML you would get an error as the library is not installed by default.
==
> library(XML)
Error in library(XML) : there is no package called ‘XML’

===
From Main menu Packages click Install package(s)...


You will get at list of Internet sites from where you can install.


Pick a site and the packages available there are displayed (USA[TN] was picked.


Pick XML from the drop-down and you will get the following response:


Once you have the package you can start programming.


Monday, October 5, 2015

How do you import data in an Excel spreadsheet into R?

MS Excel is an excellent data cruncher which also has statistics related tools to process data in the sheets. R language has package can do staitstical processing of data. Once the data is processed it can be exported so as to create reports. This import and export can be frustrating in some cases taking more time than the statistical processing. R language is language of choice for statistical processing but for not for large scale data.

The easiest type of data that can be imported is the data on a text file. Text file based data is for small and medium amount of data.
I will describe three methods of importing data from a Excel spreadsheet.

First method:
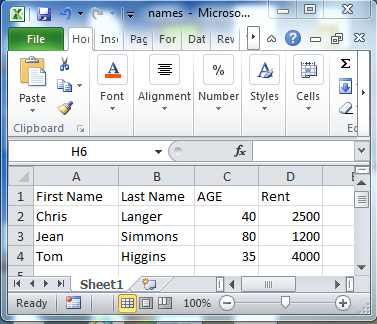
Let us take an example of data on a Excel spreadsheet as shown here:


ExcelOri

Save it as text file as shown in a previous post.

Launch R and in the prompt type as shown:
Enter the location of your .CSV file as shown and clilc Enter


You get an error:
Error: '\U' used without hex digits in character string starting ""C:\U"

We need to change the slash character as shown. Click Enter
Now you get the second error which shows all the needed attributes for calling reading a text file:
Error in scan(file, what, nmax, sep, dec, quote, skip, nlines, na.strings,  :
  line 2 did not have 3 elements


Just like Read.table(), Scan() is another function. In fact Read.table() calls Scan() to do the job. The sep in the list refers to what kind of a separator was used. In the .CSV file it is a comma.

Modify the statement to indicate that the separator is a comma and click enter.
Now the result is displayed. Row numbers and Column heading are added.

Use sep = " "  spaces or newlines
Use sep ="\t" for tab

Second method:
 
Open the Excel file shown at the top and copy the column heading and the data as shown:


R_clip
The contents are now in the "Clipboard".

Now in R enter the code as shown. After the error modify the separator (tab instead of comma)
-----------
> mydat <-read .table="" br="" file="clipboard" sep=",">> mydat
                             V1
1 First Name\tLast Name\tAGE\tRent
2         Chris \tLanger\t40\t2500
3          Jean\tSimmons\t80\t1200
4          Tom \tHiggins\t35\t4000
> mydat <-read .table="" br="" file="clipboard" sep="\t">> mydat
          V1        V2  V3   V4
1 First Name Last Name AGE Rent
2     Chris     Langer  40 2500
3       Jean   Simmons  80 1200
4       Tom    Higgins  35 4000
>

-------------------------------
Third method:

You can also use a statement like the following to display the contents of a .CSV file:
> read.csv("C:/Users/mysorian/Desktop/R_Related/names.csv")
  First.Name Last.Name AGE Rent
1     Chris     Langer  40 2500
2       Jean   Simmons  80 1200
3       Tom    Higgins  35 4000
>
=============================

Tuesday, September 15, 2015

Can you install R (version 3.2.2) programming executable on Windows 10 computer?

Yes you can.

You need to download the program from here. Double clicking will let you begin installing. The installation is quite fast on Windows 10. Accept all the defaults during installation unless you need to customize. You can see all the steps in my previous installation on a Windows 7 (x64) laptop here.
After installation you will find two shortcuts as shown:

RforWindows10.png

One of them is a shortcut for the x64bit program and the other shortcut R i386 3.2.2 is a x32bit program. Probably you only need one of them. The x64 version shortcut gets added to the Start.


Sunday, September 13, 2015

What is a good way to learn R language?

There are many ways one can learn as Internet provides a whole lot of options from free sites to sites where you can
pay and register to learn.
R language has come to focus because it can be used to carry out Data Analysis as it has strong statistical basis.
Using R one can work with graphics as well. This means the analyzed data can be pictorially displayed in terms of
graphs and charts for data visualization.
Microsoft SQL Server 2016 will have built-in support for R language and it goes without saying that learning R
programming has great value.
One way, I can think of,  is to download the R programming interface on to your computer and start from there.

Downloading and Installing R language executable for Windows 7?

While it is available for Unix/Linux, it is also available for Windows (both x32bit and x64bit). You can download the latest version here (R-3.2.2-win.exe) . The version you will be downloading is R 3.2.2 for Windows (32/64) 62MB. A small file for the complicated things it does.

Here are some download/install screen shots for those who like:

If you are installing for the first time choose that option after you access the download link above.

Rforwindows01
 
The set up for R on Windows needs to be selected:


Rforwindows04

Complete the Installation wizard screens and you are done.

You can invoke it from the desktop shortcut as shown here and the R-GUI will be displayed as shown:

Rforwindows08

It can also be invoked from Command Line and it will be easier if add the directory of the R installation (C:\Program Files\R\R-3.2.2\bin;) to the Path in your environment variables set up.

After adding the above directory to the Path in environmental variables, you can launch R as shown here:

Microsoft Windows [Version 6.1.7601]
Copyright (c) 2009 Microsoft Corporation.  All rights reserved.
C:\Users\mysorian>R
R version 3.2.2 (2015-08-14) -- "Fire Safety"
Copyright (C) 2015 The R Foundation for Statistical Computing
Platform: x86_64-w64-mingw32/x64 (64-bit)

R is free software and comes with ABSOLUTELY NO WARRANTY.
You are welcome to redistribute it under certain conditions.
Type 'license()' or 'licence()' for distribution details.

  Natural language support but running in an English locale
R is a collaborative project with many contributors.
Type 'contributors()' for more information and
'citation()' on how to cite R or R packages in publications.

Type 'demo()' for some demos, 'help()' for on-line help, or
'help.start()' for an HTML browser interface to help.
Type 'q()' to quit R.

> q()
Save workspace image? [y/n/c]: n

Now you are ready to rock and roll. You could also use the GUI shown previously (previous image).

If you enter help.start() either from GUI as shown here.

R_helpstart.png

You can also do this from command line. Note that as shown above help.Start() would produce an error as R language happens to be case sensitive, it has to be help.start().

In both cases help appears in a browser window hosted on your local IIS as shown.


This is all for today. Visit here again for more on R programming.