Showing posts with label R. Show all posts

Sunday, September 23, 2018

What is SPSS?

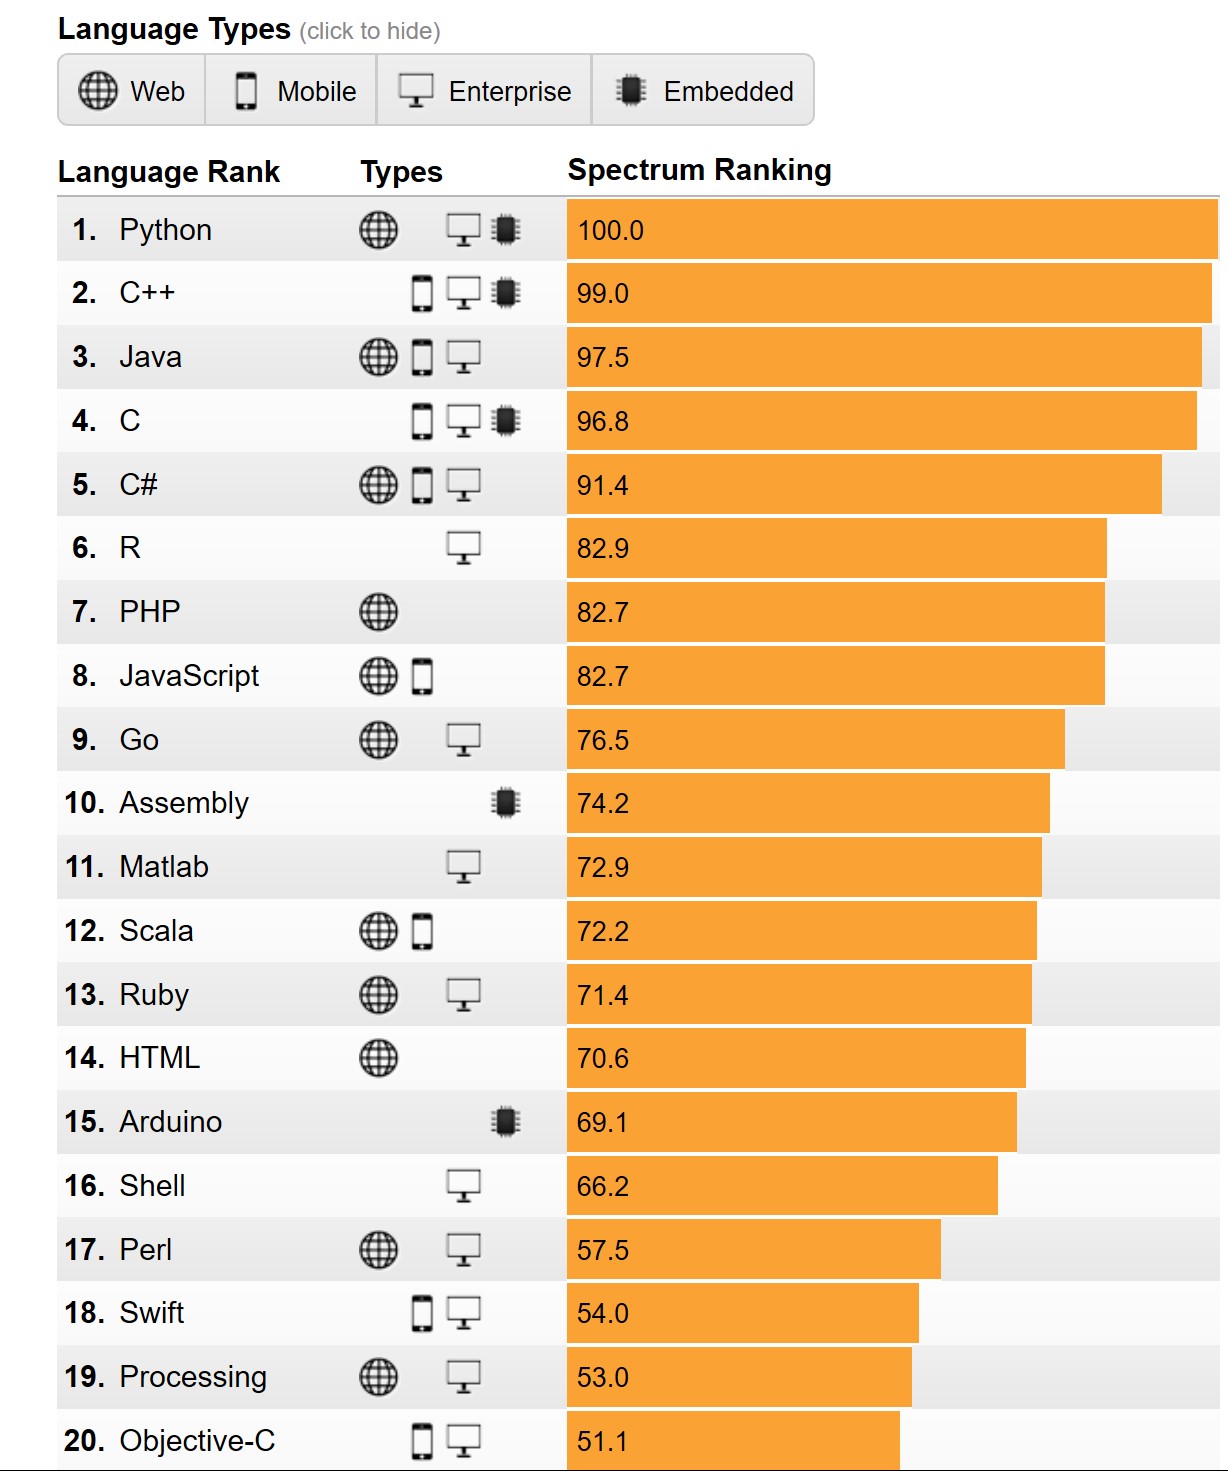
Data Science is trending. What with Machine Learning and Artificial Intelligence, learning to work with statistical analysis tools will take you far.

Here is an IBM one liner for SPSS:

"Propel research & analysis with a fast and powerful solution"

SPSS is an acronym for Statistical Software for Social Sciences. Its beginnings dates back to 1968 and it was acquired by IBM in 2009. Files created by this software have the extension .sav. SPSS outputs tables and charts that can processed by MS Word, Google Docs, Open Office, etc.

SPSS can be used for editing and analyzing data similar to other software such as R, Excel, Python, etc.

Here is a PR demo from IBM


More SPSS stuff here:

https://hodentekhelp.blogspot.com/2018/09/is-spss-software-free.html

https://hodentekhelp.blogspot.com/2018/09/how-do-you-read-spss-file-using-r.html

What kind of data can you work with in DisplayR?

From my previous post you can see that you can really get data from the following kinds of sources:
  • Get data by import
    ** SPSS Data Files
    ** SQL Tables
    ** Excel
    ** CSV
    ** Any format that R can handle

SQL tables in SQL Server, SQLite etc are obvious sources of data from relational databases against which you can run SQL Queries.

SQL data is only a small set of data sources which you can use in statistical analysis or author reports.

Here are the various from which you can source your data in DisplayR.

Qulatricss, URL, 

Thursday, August 9, 2018

What programming language do you want to learn?


Of course, you want the most popular and the most valuable.

According to the Institute of Electrical and Electronics Engineers (IEEE) , it is Python, the clear winner.

Here are the top ten in its rankings:


Why Python?

The answer appears to the fact that it iss now used for embedded applications and because it has beefed up its repertoire related to AI and Machine learning. It is for this reason R language (somewhat specialized) has seen some decline.

Microsoft C# is still standing there at 5 and probably its place will be solid 5 for all types of programming - Web, desktop and Mobile. SQL is also there but does not show up as top 10 which is understandable given its area of usage.

Well here is the first 20. Find if your favorite is here


Well, you may want to know the basis for the ranking. You can get to know here.

You can find a lot of posts on R and Python on this site.


You can find a lot of Python and R posts in my blogs.

Thursday, August 2, 2018

How do you enable Machine Learning in SQL Server 2017?

The important question is whether Machine Learning (ML) is enabled or not.

You can find if ML is enabled or not by the following:


Launch SQL Server, the version for which you want to use and start a New Query. Run the following in the context of the server:


sp_configure 'external scripts enabled'

Depending on the response to this query, you can find whether Machine Learning is installed or not. If the run_value=0, ML is not enabled.

MachineLearning_0
However the following query gives more information.


MachineLearning_1
You need to install 'Advanced Analytics Extensions' to enable Machine Learning (Using R or Python)

Wednesday, July 18, 2018

How do you parse an XML document using Python 3.70b2?

Let us start with an XML Document. Here is my XML Document saved to my computer as MyStudents.xml.


XMLParsing_0

Launch Python 3.7.0b5(x64bit) and do an import using the xml.etree.ElementTree module by importing it like,


XMLParsing_1

>>> import xml.etree.ElementTree as ET


Now you can use ET as shown here:

XMLParsing_2

Now you can get the 'root' of XML Document as in:


XMLParsing_3.jpg

You use the tag attribute of the root to get the tag.

The 'root' has children which are the four students with their ID's.

You can get all of the children as shown in the code shown below.


How is XML Documents parsed in R?
Read here.

Also here.


Parsing using JSON:
http://hodentekhelp.blogspot.com/2014/11/how-do-you-work-with-javascript-object.html

Friday, June 22, 2018

How is the exponential function handled in R?

Exponential functions are very important in all branches of physics and mathematics. It is in fact taught in the very beginning when one learns mathematics.

In R programming exp(x) calculates,  'e to the power of x' where e is the Euler's constant.

Let us calculate the values of e raised to power of x, for x=0, 1, 10, and 100 using R.


How about exponential of negative numbers like, e raised to power of y, where y=-1,-10, and -100?

R can also be used to find expm1() which is defined as follows and should be used for small values of x instead of exp():

expm1(x)=exp(x)-1=(2*tanh(x/2))/(1-tanh(x/2))


For small x expm1() is better than exp() - 1


Thursday, June 21, 2018

What is a Hadamard (Matrix) Product?

Hadamard Product is obtained by taking two matrices of the same dimension (n x n) to produce another matrix of the same dimension where each element of the new matrix is the product of corresponding elements of the two matrices.

Here is how the new Hadamard product is calculated.


Hadamard_0

Source: https://en.wikipedia.org/wiki/Hadamard_product_(matrices)

Using R you can calculate Hadamard product as shown.

Here are the two matrices.


Hadamard_1


Here is the Hadamard Product.


Hadamard_2

Wednesday, June 20, 2018

What are rbind and cbind for matrices in R?

rbind is short for row bind. rbind binds concatenated datapoints into matrix of compatible dimensions. cbind does the same taking column data.

Let us take the matrix defined in an earlier post:


MTX_0

In the above the matrix is:
     [,1] [,2] [,3]
[1,]    1    2    3
[2,]    4    5    6
[3,]    7    8    9

This has three rows. Let us define the following:

row1=c(1,2,3)
row2=c(4,5,6)
row3=c(7,8,9)


We can define the same matrix using rbind as shown below.

mtx2=rbind(row1,row2,row3)
Then we can form the matrix using the rbind as shown here:


MTX_1
 
There is a slight difference in the displayed results. However, you can perform this to get the matrix displayed in the original format as shown here:


MTX_2

The cbind works the same way as rbind. Instead of binding row-wise you bind column-wise. Of course you need to use the columns correctly.


MTX_3

Monday, June 18, 2018

How do you represent a 3x3 matrix in R?

Matrix (matrices) is a data type in R used in many mathematical problems. A matrix has rows and columns. A 3 by 3 matrix has 3 rows and 3 columns. A matrix can have only columns, only rows and both columns and rows.

Here is an example of a 3x 3 matrix.

1, 2, 3
4, 5, 6
7, 8, 9

Let us create a matrix which is obtained by arranging the data, a vector of values 1,2,3,4,5,6,7,8,9 by assigning three elements each to a row and create 3 columns from the rows. This is how you do it in R.

Matrix_1

If you want to find the elements of this matrix, you provide the row and column where your element is found as shown.

You find 5 in the 2nd row and 2nd column and you find 6 in 2nd row and 3rd column.

Matrix_2
How do you arrange the same vectors column-wise arranged. You use the same definition as in the previous but omit, byrow attribute as shown.

Matrix_3

This is just the basic but you can do a whole lot more using R.

Tuesday, May 8, 2018

How do you use Interactive Python in Visual Studio 2017 Community?

Visual Studio provides access to Interactive C#, Python and F#. We have already seen how to use C# interacitve in visual Studio.

Herein, we will start Python Interactive in Visual Studio 2017 Community IDE.

Launch Visual Studio 2017 Community from All Programs (look under V).


PythonInterA_0.png


Click Start and in the start Window click View | Other Windows as shown. You will see all interactive programs that you can use in Visual Studio.


PythonInterA_1.png

Click Python Interactive. Python 3.7 (x32) opens as shown.


PythonInterA_2.png

Enter some simple calculation to start with and note that intellisense-type feature is available as long as the DB is current.

PythonInterA_3.png


You can see the result as shown.

PythonInterA_4.png

$help command opens the help file and keyboard shortcuts as shown.


PythonInterA_5.png
That is all...

Thursday, February 15, 2018

What is the difference between WIDE and LONG format in R Programming?

First of all look at the same data in WIDE and LONG formats:

This is data in WIDE format:

Day  Segment  Jack  Jane  Tom
1      AM          2.5    3.5     1.7
2      AM          3.5    4.2     3.9
3      PM           2.5    3.9     2.1
4      PM           3.0    4.0     2.5

The same data in LONG format:
   Day   Segment   condition   measurement
1    1      AM        Jack           2.30
2    2      AM        Jack           3.50
3    3      PM        Jack           2.50
4    4      PM         Jack          3.00
5    1      AM        Jane          3.51
6    2      AM       Jane           4.20
7    3      PM       Jane            3.90
8    4      PM       Jane            4.00
9    1      AM      Tom            1.70
10   2      AM       Tom          3.90
11   3      PM       Tom           2.10
12   4      PM       Tom           2.50

You can convert from WIDE to LONG format as shown here:

Read the WIDE data using read.table() as shown here:
-----------------------
> data_wide <-read .table="" br="" header="TRUE," text="<br>+ Day Segment  Jack  Jane  Tom <br>+ 1   AM       2.3   3.51  1.7<br>+ 2   AM       3.5   4.2   3.9<br>+ 3   PM       2.5   3.9   2.1<br>+ 4   PM       3.0   4.0   2.5 <br>+ ">> data_wide
  Day Segment Jack Jane Tom
1   1      AM  2.3 3.51 1.7
2   2      AM  3.5 4.20 3.9
3   3      PM  2.5 3.90 2.1
4   4      PM  3.0 4.00 2.5
---------------------------------

R_wideData.png

Now you need to use a function gather() to do this conversion. gather() is in the
package deplyr. I installed the package tidyr that installs deplyr from CRAN mirror here:
https://cran.cnr.berkeley.edu/bin/windows
-----------
Load the library
> library(dplyr)
--------
Now do the conversion:
--------
>  data_long <- br="" condition="" data_wide="" gather="" jack="" jane="" measurement="" tom="">> data_long
   Day Segment condition measurement
1    1      AM      Jack        2.30
2    2      AM      Jack        3.50
3    3      PM      Jack        2.50
4    4      PM      Jack        3.00
5    1      AM      Jane        3.51
6    2      AM      Jane        4.20
7    3      PM      Jane        3.90
8    4      PM      Jane        4.00
9    1      AM       Tom        1.70
10   2      AM       Tom        3.90
11   3      PM       Tom        2.10
12   4      PM       Tom        2.50
>

R_longData.png

Tuesday, December 19, 2017

How do I access individual table cells in a table.read() in R?

Once you have read data into R using table.read() as described here, you can also access each of the cells in the 9 element grid of the 3 columns X 3 rows by providing row and column numbers.

You defined the table as shown here:


You can access row1, column 1 using this code:
-----------
> df[1, "Col1"]
[1] A
-----------
Using code similar to the above you can access each element providing row number and column number as shown.

df[1, Col1]   df[1, "Col2"]   df[1, "Col3"]
df[2, Col1]   df[2, "Col2"]   df[2, "Col3"]
df[3, Col1]   df[3, "Col2"]   df[3, "Col3"]

Wednesday, December 13, 2017

How do you plot using GGPLOT in Power BI?

We saw an example of plotting using GGPLOT earlier in the RGUI.

Herein we use ggplot in Power BI.

We connect to Northwind database on an instance of SQL Server 2016 Developer. We load data from Products and OrderDetails table into Power BI.

We drop the R Script Visual from the Visualizations onto the designer.


ggplot2
The R script editor opens up as shown


ggplot_03

Add the following code as shown:
-------------------------------
library(ggplot2)
y=ggplot(data=dataset, aes(x=ProductName, y=Quantity))
y=y + geom_point(aes(color="red"))

-------------------------
If you run this code using the R script

You get an error:


Now modify the above to this:
---------------------------
library(ggplot2)
y=ggplot(data=dataset, aes(x=ProductName, y=Quantity))
y=y+geom_point(aes(color="red"))
y=y+geom_point(aes(size=Quantity))
y

---------------------
Now run the script. You will see the plot as shown. The size shows the value of "Quantity" and the color=red is supposed to make it red.


The correct code for aes is modified to this:
-------------------
library(ggplot2)
y=ggplot(data=dataset, aes(x=ProductName, y=Quantity))
y=y+geom_point(aes(size=Quantity, color="red"))
y

-------------------
Run this code again. You get the following visualization.

Looks like there may some error in rendering of the color. Changing it to blue makes it still 'red'.


Friday, December 8, 2017

How do you plot data with ggplot?

After knowing your data, visualizing data is the next most important thing.

Report writing, analyzing data and mining data all require data visualization. It is a must for all including the data scientists.

There are various data visualization software such as Power BI, SQL Server Reporting Services, Tableau etc, but ggplot outshines them in many ways besides being free, like air. GGPLOT also happens to be the most used tool especially in serious science and  statistics.

Let us get some data to plot using GGPLOT.

In my previous post I have created a csv file that we can use. Read about this csv file here:

http://hodentekhelp.blogspot.com/2017/02/how-do-you-import-text-file-into.html

How do you plot data with ggplot?

Launch R GUI from your Microsoft R folder here:


Get this data into a data frame using this code in R

> df <- csv="" esktop="" header="TRUE)</font" log2017="" read.csv="" sers="" wner="">
The data can be displayed in R as follows:


ggplot_data2

Now I assume you have the ggplot package. If you do not have get it as shown here:

http://hodentekhelp.blogspot.com/2015/11/what-is-needed-to-visualize-data-in-r.html

Load the library of ggplot as shown here:

> library(ggplot2)


Now run the following code in R
> z=ggplot(data=df, aes(x=productName, y=Quantity))
This just loads the data to ggplot but will not plot. You need to tell what kind of geometrical object we use to plot and that we specify by geom_point(). It is some what of unintuitive way but that is how it works.
The code to plot would be as shown:
-----------
> y=ggplot(data=df, aes(x=ProductName, y=Quantity))+geom_point()
> y
--------------
This brings up the graphic R window as shown (if you do not see this, click on the
windows menu item in R)


ggplot23_plot.png


Agreed that this is not a great set of data, but it is enough to illustrate the most basic step of visualizing data with ggplot().

The function aes() is called the aesthetics. You will learn that the name of this function is quite appropriate. That will be for another day.

Monday, November 27, 2017

What are the differences for Sparklines in Microsoft Excel and in R?

These are the sparkline related functions in R:
newSparkLine()
newSparkBar()
newSparkBox()
newSparkHist()
newSparkTable()

You could get access to sparkLines in R using the package "sparkTable"
You may need to get the Package from a CRAN Site.

These functions are used with plot(). If the method export() is used then they are saved as mini-plots in png,eps and pdf.

The Spark lines in MS Excel are:


SparkLine_00

SparkLine_01

Excel Sparklines

It is straightforward to use in Excel as long as you have the data as in the posts.
http://hodentekhelp.blogspot.com/2017/06/how-do-you-create-sparklines-in-excel.html
http://hodentekhelp.blogspot.com/2017/06/how-does-winloss-sparkline-work.html

Examples (graphic) of Sparkline(), Sparkbar() and


R Reference for SparkTable()
https://cran.r-project.org/web/packages/sparkTable/sparkTable.pdf
R has a larger option with sparklines than Microsoft Excel.

Tuesday, March 28, 2017

Are there tools to look at financial information of the stock market in R?

I read a very illuminating article on R-Bloggers which was originally published on R-Curtiss Miller's Personal Website (https://ntguardian.wordpress.com/2017/03/27/introduction-stock-market-data-r-1/).

Ever since Microsoft SQL Server began supporting R in its 2016 version, I got interested in R language. It is extremely rich with wide applicability from Astronomy(http://www.astro.umd.edu/~harris/r/index.html) to Zoology(https://www.zoology.ubc.ca/~schluter/R/data/) and everything in between.

Financial information from Yahoo as the source, the packgae 'quantmod' brings with it most of the useful financial information about stocks. quantmod gets data from Yahoo Finance and Google Finance plus from other sources.

In order to work with financial data you should download the package which can done as shown:
------------
> # Get quantmod
> if (!require("quantmod")) {
+     install.packages("quantmod")
+     library(quantmod)
+ }
Loading required package: quantmod
Installing package into ‘C:/Users/Jayaram/Documents/R/win-library/3.2’
(as ‘lib’ is unspecified)
--- Please select a CRAN mirror for use in this session ---
also installing the dependencies ‘xts’, ‘zoo’, ‘TTR’
[ I chose the CRAN site in California ]
trying URL 'https://cran.cnr.berkeley.edu/bin/windows/contrib/3.2/xts_0.9-7.zip'
Content type 'application/zip' length 662188 bytes (646 KB)
downloaded 646 KB

trying URL 'https://cran.cnr.berkeley.edu/bin/windows/contrib/3.2/zoo_1.7-14.zip'
Content type 'application/zip' length 905140 bytes (883 KB)
downloaded 883 KB

trying URL 'https://cran.cnr.berkeley.edu/bin/windows/contrib/3.2/TTR_0.23-1.zip'
Content type 'application/zip' length 432456 bytes (422 KB)
downloaded 422 KB

trying URL 'https://cran.cnr.berkeley.edu/bin/windows/contrib/3.2/quantmod_0.4-7.zip'
Content type 'application/zip' length 473601 bytes (462 KB)
downloaded 462 KB

package ‘xts’ successfully unpacked and MD5 sums checked
package ‘zoo’ successfully unpacked and MD5 sums checked
package ‘TTR’ successfully unpacked and MD5 sums checked
package ‘quantmod’ successfully unpacked and MD5 sums checked

The downloaded binary packages are in
        C:\Users\Jayaram\AppData\Local\Temp\RtmpOIHqF6\downloaded_packages
Loading required package: xts
Loading required package: zoo

Attaching package: ‘zoo’

The following objects are masked from ‘package:base’:

    as.Date, as.Date.numeric

Loading required package: TTR
Version 0.4-0 included new data defaults. See ?getSymbols.
Warning messages:
1: In library(package, lib.loc = lib.loc, character.only = TRUE, logical.return = TRUE,  :
  there is no package called ‘quantmod’
2: package ‘quantmod’ was built under R version 3.2.5
3: package ‘xts’ was built under R version 3.2.5
4: package ‘zoo’ was built under R version 3.2.5
5: package ‘TTR’ was built under R version 3.2.5
---------------
Once it is installed. You can set up start and end dates variables for viewing your stocks like in:
start<- as.date="" br="">end <- as.date="" br="">
With these defined, you can get the Apple's stock price using its ticker symbol AAPL using the functions in the package as shown obtaining data from the Yahoo source.
> getSymbols("AAPL", src="yahoo", from=start, to=end)
To view the data just run the statement
head(AAPL)

Monday, July 4, 2016

How can I parse an XML file in one of my folders in R programming?

In the previous post, the file was placed on the local internet server and a URL reference was given. It does not have to be that way. The file can be in the folders/files and you just need to change the code a little bit as shown. I am using the same file I used in the previous post.

These are the three lines needed to parse the XML file in the following directory:
------------------
> library(XML)
> fileName="C:\\Users\\Jayaram\\Desktop\\SQLServer2016D\\R Server\\Mystudents.xml"
> xmlFile <- filename="" font="" readlines="" xmltreeparse="">
-------------

And this produces the same result as in the previous post.

---------
$doc
$file
[1] ""

$version
[1] "1.0"

$children
$children$root

 
  Linda Jones
  Access, VB5.0


  Adam Davidson
  Cobol, Mainframe


  Charles Boyer
  HTML, Photoshop


  Charles Amos
  Cobol, Mainframe
 

-------------------
Follow the warnings in the previous post. Also make sure that the file name is typed in as shown in the post (note the double slashes).

Friday, July 1, 2016

How to parse a XML document in R?

This post shows how to parse a XML document in R. I often use the following simple xml file for my posts and examples. Please find some precautions at the end of this post.


MyStudentsXMLDoc

If your xml doccument is not on the local server, you can easily place it on the server by copying and pasting the xml document(file) to the local server root (inetpub/wwwroot).

The steps to parse use the xml function xmlTreeParse as shown by the following:
The program uses the readLines() function to read the document as shown and you code these after launching R Studio or R Gui.


MyStudnetsXMLDoc_2

You immediately get the following response as shown here:

$doc
$file
[1] ""

$version
[1

$children
$children$wclass


  Linda Jones
  Access, VB5.0


  Adam Davidson
  Cobol, Mainframe


  Charles Boyer
  HTML, Photoshop


  Charles Amos
  Cobol, Mainframe


attr(,"class")
[1] "XMLDocumentContent"

$dtd
$external
NULL

$internal
NULL

attr(,"class")
[1] "DTDList"


1. R programs are case sensitive and pay attention to how they are typed-in
2. The Mystudents.xml file should have a final carriage return. If not you will end up with an error:
 incomplete final line found on 'http://localhost/Mystudents.xml'


Friday, May 27, 2016

What is the difference between factorial and lfactorial in R programming?

Factorial computes the factorial of a number. Given a number n it computes n! (n factorial). You can follow this after launching the R Gui. 5! is same as 5x4x3x2x1
---------------
> factorial(5)
[1] 120
---------------
factorial in R programming is also applicable to non-integers.
------
> factorial(5.5)
[1] 287.8853
-------------
How does R programming calculates factorial. It is calculated in the most efficient manner using the Gamma function.
factorial(x)=gamma(x+1)

In implementation to calculate factorial R calculates the gamma
factorial(5)=gamma(5+1)
------
> gamma(5+1)
[1] 120  - This is same as factorial(5)
----
What about lfactorial in R programming?

The definition of lfactorial (http://www.stata.com/manuals13/m-5factorial.pdf) is ;
lfactorial(n) is log(factorial(n))
-----
> lfactorial(5)
[1] 4.787492
> log(factorial(5))
[1] 4.787492
------------
Another interesting tip is you can use factorial function presenting it with a list like factorial(c(5,4,3)) and not a number. It would then compute the factorial for each of the numbers. For example:
----
> factorial(c(5,4,3))
[1] 120  24   6
> factorial(c(5,4.3,2))
[1] 120.00000  38.07798   2.00000
> lfactorial(c(5,4,3))
[1] 4.787492 3.178054 1.791759
----------

Friday, December 4, 2015

What is R Studio and how do I get it?

R Studio is an integrate development environment (IDE) for R programming. You can do everything  you do in R and much more.
The download link for R Studio is here (https://www.rstudio.com/products/rstudio/download/)

If you download now you get the version RStudio-0.99.489.exe (~76MB). Double click this executable and you will install R Studio. While installing you can choose the location where you want it installed.

The R Studio IDE is launched when you double click the shortcut after installation. On a Windows 10 computer an app will be installed in All Apps. The R Version is 3.2.2.