After knowing your data, visualizing data is the next most important thing.
Report writing, analyzing data and mining data all require data visualization. It is a must for all including the data scientists.
There are various data visualization software such as Power BI, SQL Server Reporting Services, Tableau etc, but ggplot outshines them in many ways besides being free, like air. GGPLOT also happens to be the most used tool especially in serious science and statistics.
Let us get some data to plot using GGPLOT.
In my previous post I have created a csv file that we can use. Read about this csv file here:
http://hodentekhelp.blogspot.com/2017/02/how-do-you-import-text-file-into.html
How do you plot data with ggplot?
Launch R GUI from your Microsoft R folder here:

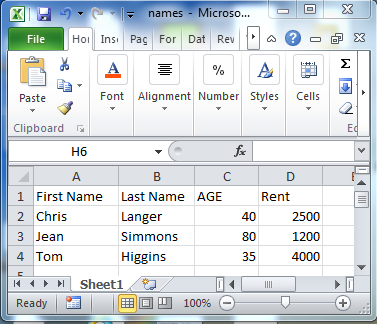
Get this data into a data frame using this code in R
> df <- csv="" esktop="" header="TRUE)</font" log2017="" read.csv="" sers="" wner="">
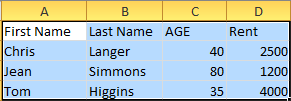
The data can be displayed in R as follows:

ggplot_data2
Now I assume you have the ggplot package. If you do not have get it as shown here:
http://hodentekhelp.blogspot.com/2015/11/what-is-needed-to-visualize-data-in-r.html
Load the library of ggplot as shown here:
> library(ggplot2)
Now run the following code in R
> z=ggplot(data=df, aes(x=productName, y=Quantity))
This just loads the data to ggplot but will not plot. You need to tell what kind of geometrical object we use to plot and that we specify by geom_point(). It is some what of unintuitive way but that is how it works.
The code to plot would be as shown:
-----------
> y=ggplot(data=df, aes(x=ProductName, y=Quantity))+geom_point()
> y
--------------
This brings up the graphic R window as shown (if you do not see this, click on the
windows menu item in R)

ggplot23_plot.png
Agreed that this is not a great set of data, but it is enough to illustrate the most basic step of visualizing data with ggplot().
The function aes() is called the aesthetics. You will learn that the name of this function is quite appropriate. That will be for another day.
Report writing, analyzing data and mining data all require data visualization. It is a must for all including the data scientists.
There are various data visualization software such as Power BI, SQL Server Reporting Services, Tableau etc, but ggplot outshines them in many ways besides being free, like air. GGPLOT also happens to be the most used tool especially in serious science and statistics.
Let us get some data to plot using GGPLOT.
In my previous post I have created a csv file that we can use. Read about this csv file here:
http://hodentekhelp.blogspot.com/2017/02/how-do-you-import-text-file-into.html
How do you plot data with ggplot?
Launch R GUI from your Microsoft R folder here:

Get this data into a data frame using this code in R
> df <- csv="" esktop="" header="TRUE)</font" log2017="" read.csv="" sers="" wner="">
The data can be displayed in R as follows:

ggplot_data2
Now I assume you have the ggplot package. If you do not have get it as shown here:
http://hodentekhelp.blogspot.com/2015/11/what-is-needed-to-visualize-data-in-r.html
Load the library of ggplot as shown here:
> library(ggplot2)
Now run the following code in R
> z=ggplot(data=df, aes(x=productName, y=Quantity))
This just loads the data to ggplot but will not plot. You need to tell what kind of geometrical object we use to plot and that we specify by geom_point(). It is some what of unintuitive way but that is how it works.
The code to plot would be as shown:
-----------
> y=ggplot(data=df, aes(x=ProductName, y=Quantity))+geom_point()
> y
--------------
This brings up the graphic R window as shown (if you do not see this, click on the
windows menu item in R)

ggplot23_plot.png
Agreed that this is not a great set of data, but it is enough to illustrate the most basic step of visualizing data with ggplot().
The function aes() is called the aesthetics. You will learn that the name of this function is quite appropriate. That will be for another day.