Showing posts with label Excel. Show all posts

Tuesday, March 16, 2021

How well does the Stock data type work in MS Excel?

 Microsoft introduced the Stock datatype previously. It does work with a few minor points of irritation. Still, I recommend this program for retail, individual investors with the usual warning that you do so at your own risk.

The problems I have noticed are the following:

1. New IPOs take considerable time to appear, sometimes weeks

2. Suddenly you start seeing the message that some of the items could not be updated, etc.

3. Recently, the Excel program is getting sluggish (not all the time but enough to cause discomfort) and the controls for FILE, Data, View, etc. get slowed down to the extent, you rapidly lose heart and interest.

4. Sometimes the stock data type does not get updated even after using the 'Refresh' control. Only one submenu item gets enabled in the 'Refresh, button.

5. Interestingly if you create a new instance of the stock in a different cell, it gets updated.

The program should work without these hitches if it has to be taken seriously.

This is the version of Office365/Excel I am using on Windows 10 (x64) with the most current update:


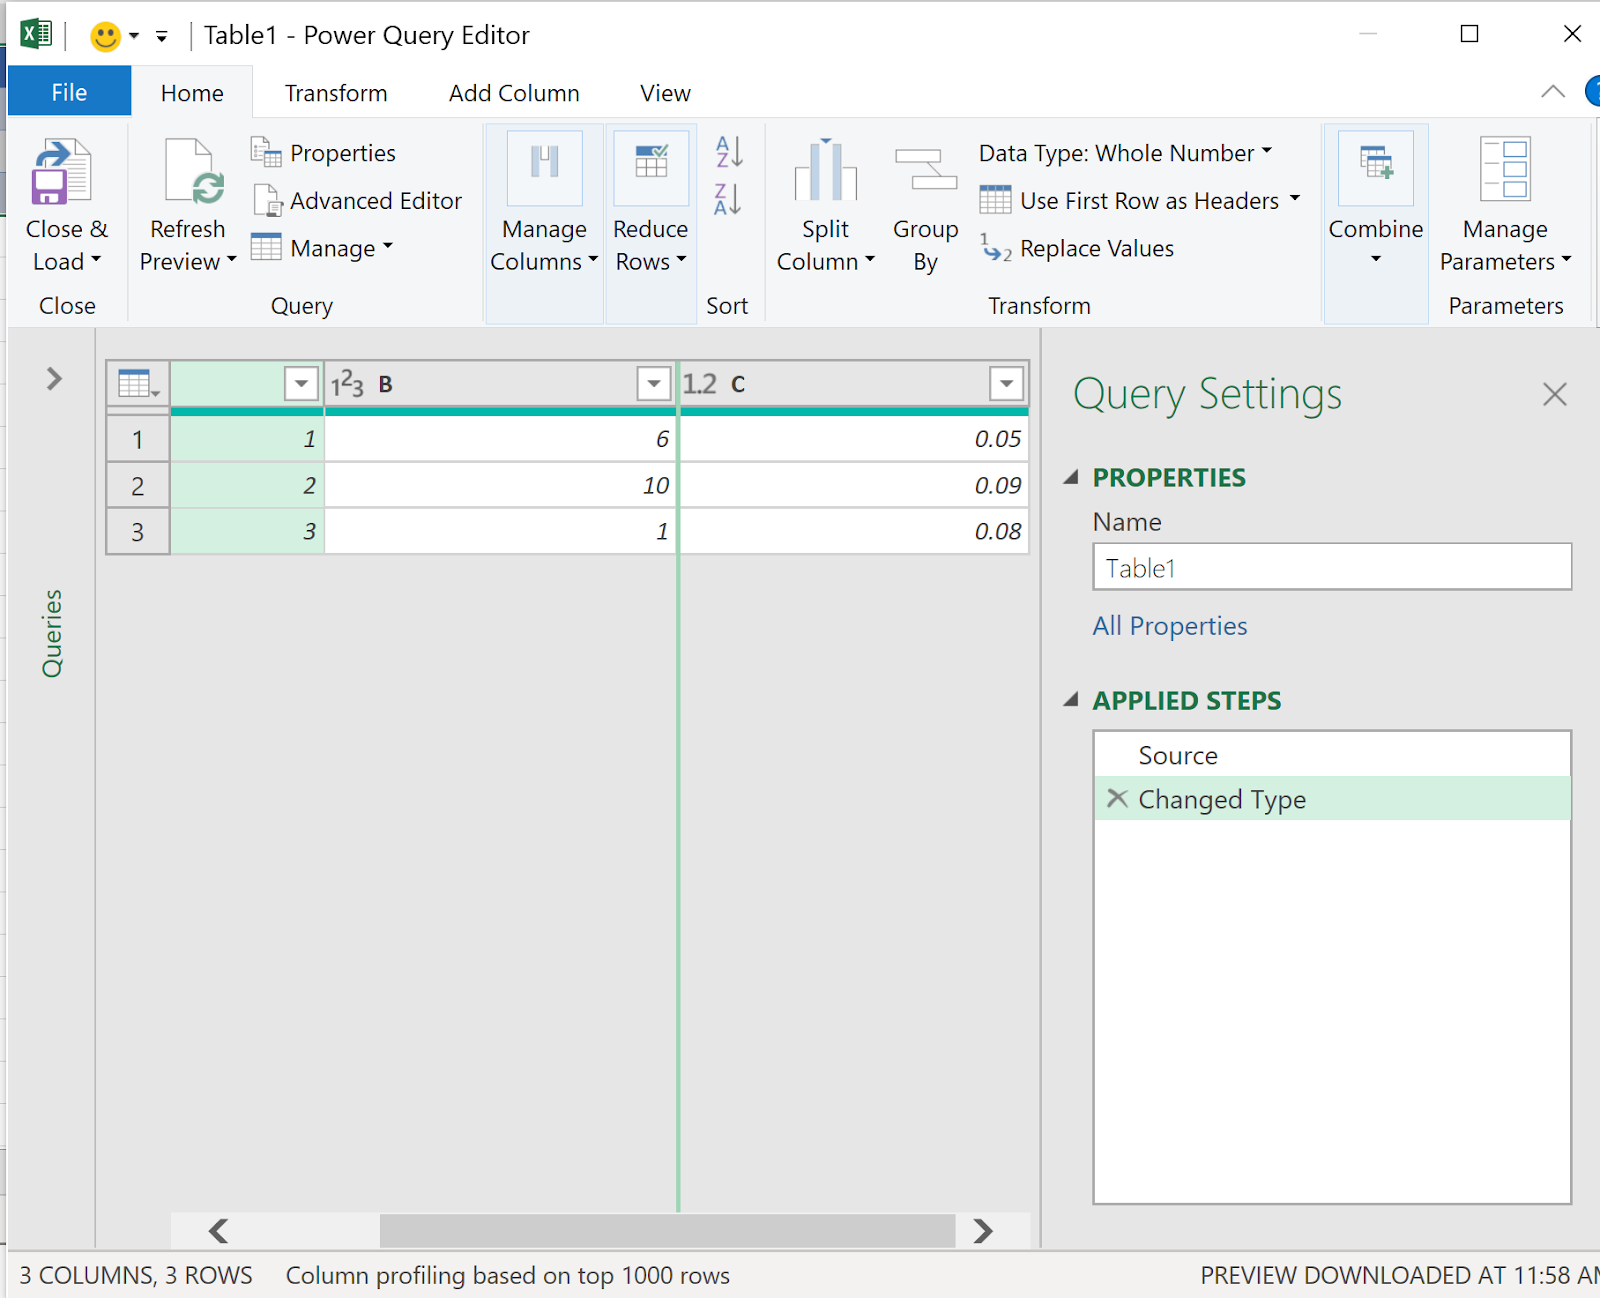
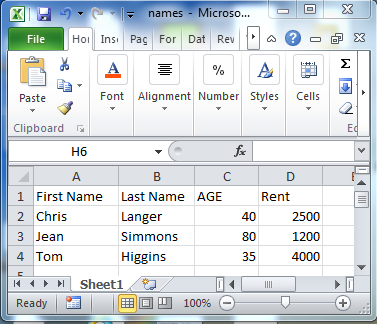
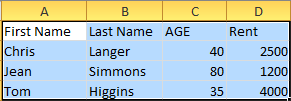
Here are some pictures of misbehaving Excel sheets:


Obviously, the feedback has been sent a couple of times.


Here are some links if you are not familiar with the STOCK data type in Excel.

How do you use the stock data type in MS Excel?

https://hodentekhelp.blogspot.com/2020/05/how-do-you-use-stock-data-type-in-ms.html


Does Stock Analysis with Microsoft Excel Work?

https://hodentekhelp.blogspot.com/2016/03/does-stock-analysis-with-microsoft.html


How do you extract financial data from the web using MS Excel?

https://hodentekhelp.blogspot.com/2020/06/how-do-you-extract-financial-data-from.html


How do you create a moving average using MS Excel?

https://hodentekhelp.blogspot.com/2017/10/how-do-you-create-moving-average-using.html


Good luck!


Saturday, December 12, 2020

How does 'Drag to flash fill' works in MS EXCEL?

 The first two columns have the 'first' and 'last' names in them. Now I want to flash fill column C. I am not going to use a function or another way of concatenating the 'first' and 'last' names to come up with the last name in column C.

The icon shown in the next image will be useful for flash filling.

Now type a pattern such as 'Jay Krish' in the first row of Column C. Note this is just a pattern. 


Now place your cursor in column C's first row and click the icon shown previously.

The rest of the rows follow the pattern of the first row. You also see the flash fill icon on your data row.


How does dragging to fill rows of a column work in MS Excel work?

 Microsoft Excel is built for productivity and dragging the mouse on an Excel sheet is one such trick that increases the productivity.

It is better that I explain with examples.

In this example, you just place a number in a cell.


Drag down as suggested.

Well, this is not interesting. It just COPIED the starting cell.  This is because, the default drag-down operation is COPY.

In the above if you choose the option Fill Series, it will fill the consecutive numbers starting from 1.

Another example here. I just entered the first date as 1/1/2021 and dragged down and this is what I get.


Here is another example.

Well, here is an example. In the first column I have the first name of a client, in the second I have the last name. In the third column, I use the CONCAT () function to fill the first name. I just have to do this for the first row. 


After evaluating the function, I just DRAGGGGGGGGGGGGGGG! Voila, it fills the rest.


Instead of CONCAT (), the following also works.


Click here to see how 'flash fill' works.


Saturday, September 26, 2020

How do you work with statistics in Microsoft Excel?

Microsoft Excel makes it ridiculously easy to work with statistics. Excel has a number of built-in functions that you can use relatively easily. These are backed up with enough documentation to use the functions.

These four steps show how:

Access Add a function using fx:


Insert function window opens as shown.


In the Insert Function window scroll down the drop-down list and choose 'Statistical'. This has a long list of functions available.


Let us take an example of the function 'Trend'

Scroll down the available function list till you get to 'Trend' as shown.

Click  the 'Help on this function' link. The web page (https://tinyurl.com/y5r94tp5) for this function opens. A part of this page's image is shown here:


If the tiny URL does not work, try this ugly link:


Monday, June 15, 2020

Can a calculation go wrong in MS Excel?

There is such a thing called a rogue!

It did once in all these years (30 yrs) I have used EXCEL. I simply cannot figure it out. I include a screenshot of what I observed.


As a workaround, I deleted the line and recreated it. Everything OK.

Thursday, June 11, 2020

Sunday, May 24, 2020

How do you use the stock data type in MS Excel?

This is the easiest way to work on your stock holdings using Excel. The stock data type is awesome. Just one entry in a cell gives everything you want to know about your stock. You can build applications with it, but I will show you how to do it in three simple steps.

Step 1. Open a cell and enable it for stock data type using the Data menu.


Step 2: Open a cell or cells (I am just showing ROKU in one cell). You can type in stock ticker symbols in any number of rows in the same column. Highlight the column each row of which contains a ticker symbol and click Stocks in the Data Menu. By the way, I just typed ROKU and it changes to Roku Inc.(XNAS:ROKU)


Step 3: Now you pick the items you want to see in the little icon with a + in green. I choose Price (scrolling down this list) and in the adjoining column the current price will be displayed. You can see other items like 52 Week high, 52 Week low, Industry, etc. 


I have added 5% down, 15% down of the stock I sold on a particular date, etc. if you are interested in using it for trading. you could also have a link to your investment account and trade as easily.

Monday, May 18, 2020

How do you hide and unhide worksheets?

You can hide and unhide all columns in an Excel worksheet as shown in the following images:

I will hide all columns in HideAll.xlsx by clicking in the corner as shown. All cells are highlighted.


Now I go to the VIEW menu and click Hide.


Now everything is hidden. Notice even the worksheet name.


 Now I go back to VIEW and click on View to activate the Unhide submenu item.


 I click the Unhide button and I get the window for unhiding where I can choose to unhide the file.


Click on HideAll.xlsx. The HideAll.xlsx is displayed showing all columns and rows.


Wednesday, May 13, 2020

How do you query data in a MS Excel Worksheet?


Excel has a tool called Power Query which can be used to query data from many data sources, external data sources, or a source in an Excel worksheet, such as a table.

Here are the types of external data you can query using Excel.
Power Query Data Sources

Web page

Excel or CSV file

XML file

Text file

Folder

SQL Server database

Microsoft Azure SQL Database

Access database

Oracle database

IBM DB2 database

MySQL database

PostgreSQL Database

Sybase Database

Teradata Database

SharePoint List

OData feed

Microsoft Azure Marketplace

Hadoop File (HDFS)

Microsoft Azure HDInsight

Microsoft Azure Table Storage

Active Directory

Microsoft Exchange

Facebook

In the present post, you can see how you can query data in a worksheet, using Power query.

The following three steps show how you may do it.


 In the above worksheet, I created a table. Inserted three rows of data and highlighted them. Then I clicked, Insert and, picked up Create Table from the drop-down. This gave me the second dialog Create Table pre-filled with my data. I then clicked OK to create a table as shown in the bottom of the above.


Now I clicked Data and Query and Connections. I then clicked the option From/Table Range to Open the Power Query Editor. 


Now it is straight forward to query the Table in Excel worksheet.

More on Power Query here:

https://support.office.com/en-us/article/introduction-to-microsoft-power-query-for-excel-6e92e2f4-2079-4e1f-bad5-89f6269cd605

Sunday, September 23, 2018

What is SPSS?

Data Science is trending. What with Machine Learning and Artificial Intelligence, learning to work with statistical analysis tools will take you far.

Here is an IBM one liner for SPSS:

"Propel research & analysis with a fast and powerful solution"

SPSS is an acronym for Statistical Software for Social Sciences. Its beginnings dates back to 1968 and it was acquired by IBM in 2009. Files created by this software have the extension .sav. SPSS outputs tables and charts that can processed by MS Word, Google Docs, Open Office, etc.

SPSS can be used for editing and analyzing data similar to other software such as R, Excel, Python, etc.

Here is a PR demo from IBM


More SPSS stuff here:

https://hodentekhelp.blogspot.com/2018/09/is-spss-software-free.html

https://hodentekhelp.blogspot.com/2018/09/how-do-you-read-spss-file-using-r.html

Wednesday, November 8, 2017

How do you find what version of Excel you are using?

I have a Microsoft Office 365 Business subscription.

Click File on the main menu of a Excel document to bring up a list of other items that you may want to find out as shown.


ExcelVersion_0

Click Account to open the account details on the right as shown.


ExcelVersion_1

Click About Excel on the icon to display the following:


ExcelVersion_2

The version used here is x32 bit.

Friday, June 16, 2017

How do you create Sparklines in Excel?

Sparklines are tiny charts of related information covering a range of data placed in an EXCEL cell.

I have Microsoft Office 365 Business version 1704. I will describe using this version of Excel. The data I choose to show is the data related to Opoid related deaths in New York state. I tried to get this data as data from Excel's (Data |From Web) Web menu item in Excel but it was not easy. I just copied and pasted and made some changes. The website for this data is coming
from here:

http://lohud.nydatabases.com/database/opioid-related-deaths-new-york-state

Here is a sample data in a Excel Spreadsheet.


Opoid_00.png

I have the data for all the counties, but the above has only for the top couple of counties.

In Excel you can create the following types of Sparklines:


Opioid_01.png

I will describe how to show the sparklines for the Opoid deaths for say the three counties Albany, Allegany and Bronx.

Highlight the data for the three counties as shown (keep a blank column for the Sparklines). Note that to show with some clarity, the row height has been changed.


Opioid_02.png

Click Sparklines and choose column.
The Sparklines gets into the next column as shown.


Opioid_03.png

Now you can see how the death varied from 2003 to 2014 in the three counties on a comparative basis. Looks like Allegany made the best changes.

Monday, October 5, 2015

How do you import data in an Excel spreadsheet into R?

MS Excel is an excellent data cruncher which also has statistics related tools to process data in the sheets. R language has package can do staitstical processing of data. Once the data is processed it can be exported so as to create reports. This import and export can be frustrating in some cases taking more time than the statistical processing. R language is language of choice for statistical processing but for not for large scale data.

The easiest type of data that can be imported is the data on a text file. Text file based data is for small and medium amount of data.
I will describe three methods of importing data from a Excel spreadsheet.

First method:
Let us take an example of data on a Excel spreadsheet as shown here:


ExcelOri

Save it as text file as shown in a previous post.

Launch R and in the prompt type as shown:
Enter the location of your .CSV file as shown and clilc Enter


You get an error:
Error: '\U' used without hex digits in character string starting ""C:\U"

We need to change the slash character as shown. Click Enter
Now you get the second error which shows all the needed attributes for calling reading a text file:
Error in scan(file, what, nmax, sep, dec, quote, skip, nlines, na.strings,  :
  line 2 did not have 3 elements


Just like Read.table(), Scan() is another function. In fact Read.table() calls Scan() to do the job. The sep in the list refers to what kind of a separator was used. In the .CSV file it is a comma.

Modify the statement to indicate that the separator is a comma and click enter.
Now the result is displayed. Row numbers and Column heading are added.

Use sep = " "  spaces or newlines
Use sep ="\t" for tab

Second method:
 
Open the Excel file shown at the top and copy the column heading and the data as shown:


R_clip
The contents are now in the "Clipboard".

Now in R enter the code as shown. After the error modify the separator (tab instead of comma)
-----------
> mydat <-read .table="" br="" file="clipboard" sep=",">> mydat
                             V1
1 First Name\tLast Name\tAGE\tRent
2         Chris \tLanger\t40\t2500
3          Jean\tSimmons\t80\t1200
4          Tom \tHiggins\t35\t4000
> mydat <-read .table="" br="" file="clipboard" sep="\t">> mydat
          V1        V2  V3   V4
1 First Name Last Name AGE Rent
2     Chris     Langer  40 2500
3       Jean   Simmons  80 1200
4       Tom    Higgins  35 4000
>

-------------------------------
Third method:

You can also use a statement like the following to display the contents of a .CSV file:
> read.csv("C:/Users/mysorian/Desktop/R_Related/names.csv")
  First.Name Last.Name AGE Rent
1     Chris     Langer  40 2500
2       Jean   Simmons  80 1200
3       Tom    Higgins  35 4000
>
=============================

Wednesday, September 23, 2015

How to create a CSV file?

The present post describes creating a Comma Separated Value (CSV) file using Microsoft Excel.

CSV files are very popular and frequently used data transformation formats since legacy data are usually of this type. In recent times XML and JSON formatted data has replaced them.

However, there is a whole lot of legacy data that needs to be loaded on to more recent databases. Hence, every database vendor provides a program to accomplish this conversion. Also programs exist which takes a CSV file and convert it into an XML file. Perhaps this is another route one can take in data conversions for legacy data.

You can create a CSV file using Microsoft Excel in all versions.
Here is an example of a CSV file.
------------
First Name,Last Name,AGE,Rent
Chris ,Langer,40,2500
Jean,Simmons,80,1200
Tom ,Higgins,35,4000

--------------
The first row in the above are headers (providing column names) and the rest is data.

Step 1:
Create an Excel file as shown by typing in the cell entries after launching the Microsoft Excel (herein Excel 2010).

namesExcel.png

Step 2:
Click File to display drop-down. You will be saving the file as names in the CSV format.


ExcelSaveAs.png

 
Step 3: Click Save As to open the Save As dialog as shown. You have a variety of options to choose from. Pick MS-DOS (CSV )as the Excel file type as shown.


ExcelSaveOptions

 
Step 4:
Provide a name for the file and accept the default folder. You get the following warning:

Excel Permissions

Accept the provided location (My Documents) by cliking Yes. The document gets saved to the location.

 A word of caution. If you have multiple sheets (usually when launched there will be three sheets). Delete the two extra sheets and just keep one sheet. You will get an error message if you have more than one sheet while saving it as a CSV file.

Tuesday, June 2, 2015

What is Microsoft Solver Foundation?

It is a set of tools to work on mathematical simulation, optimization and modelling. It uses the managed execution and common language runtime (CLR). This means you can use any of the CLR languages including VB, Visual C++, Visual C#, Visual F#, and IronPython.
Of course you can also use ASP.NET and Silverlight in your mathematical operations.

Mathematical Solver Foundation APIs
  • Can run remotely as a service within IIS and ASP.NET
  • Can run in Excel as an add-in
  • Integrate with other .NET Framework apps
  • Embed as DSL within CLR languages
  • Embed as a CLR compliant module.
Review this link for more:
https://msdn.microsoft.com/en-us/library/ff524497(v=vs.93).aspx

Monday, June 21, 2010

How do I export and import from MS Excel in XML format ?

MS Excel has import functionality.

You can also use SQL Server 2008 R2's (even earlier versions can be used) Import and Export Wizard.

A more generic tool and that is especially meant or Import/Export of even more complicated situations is MS SQL Server Integration Services.

The following design diagram shows roughly what you should be considering. If you use left two items you will be exporting from Excel to SQL Server and if you use the right two items you will be importing from SQL Server to Excel.

  This is all very simply explained in my book which I do recommend.