Basically you need a graphic program.
When you install R you already have a basic graphic package and you can verify it by using the command
library() in the R Gui. If you do not have R on your computer you should get one as described
here. It is really quite easy.
Graphics_00.png
Installing R gets only Graphics in the above list of packages. While this is a basic package, you also can use the more comprehensive plotting package called
ggplot2.
You install it using the following command:
> install.packages("ggplot2")
 Graphics_01.png
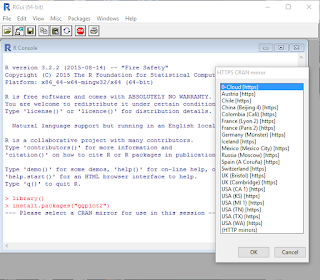
Since it is not on the machine a list of mirror sites will be displayed where you can get the package. When I chose 'California' (US(CA 1), mirror in this list, after going to the site the program returned the message that 'ggplot2' is not available for R version 3.2.2.
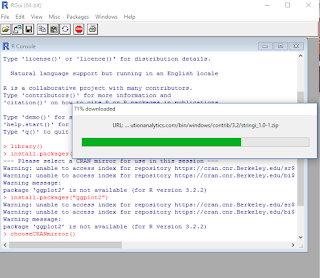
When the search failed, the R Gui came up with the following command:
>chooseCranmirror()
When a different mirror site in Texas was chosen, the program was able to download and install it on the computer.
The result of installing is shown here, copied from the R GUI interface:
----
> chooseCRANmirror()
> install.packages("ggplot2")
also installing the dependencies ‘stringi’, ‘magrittr’, ‘colorspace’, ‘Rcpp’, ‘stringr’, ‘RColorBrewer’, ‘dichromat’, ‘munsell’, ‘labeling’, ‘plyr’, ‘digest’, ‘gtable’, ‘reshape2’, ‘scales’, ‘proto’
trying URL 'https://cran.revolutionanalytics.com/bin/windows/contrib/3.2/stringi_1.0-1.zip'
Content type 'application/zip' length 14265659 bytes (13.6 MB)
downloaded 13.6 MB
trying URL 'https://cran.revolutionanalytics.com/bin/windows/contrib/3.2/magrittr_1.5.zip'
Content type 'application/zip' length 149844 bytes (146 KB)
downloaded 146 KB
trying URL 'https://cran.revolutionanalytics.com/bin/windows/contrib/3.2/colorspace_1.2-6.zip'
Content type 'application/zip' length 393156 bytes (383 KB)
downloaded 383 KB
trying URL 'https://cran.revolutionanalytics.com/bin/windows/contrib/3.2/Rcpp_0.12.1.zip'
Content type 'application/zip' length 3189762 bytes (3.0 MB)
downloaded 3.0 MB
trying URL 'https://cran.revolutionanalytics.com/bin/windows/contrib/3.2/stringr_1.0.0.zip'
Content type 'application/zip' length 82841 bytes (80 KB)
downloaded 80 KB
trying URL 'https://cran.revolutionanalytics.com/bin/windows/contrib/3.2/RColorBrewer_1.1-2.zip'
Content type 'application/zip' length 26681 bytes (26 KB)
downloaded 26 KB
trying URL 'https://cran.revolutionanalytics.com/bin/windows/contrib/3.2/dichromat_2.0-0.zip'
Content type 'application/zip' length 147785 bytes (144 KB)
downloaded 144 KB
trying URL 'https://cran.revolutionanalytics.com/bin/windows/contrib/3.2/munsell_0.4.2.zip'
Content type 'application/zip' length 126094 bytes (123 KB)
downloaded 123 KB
trying URL 'https://cran.revolutionanalytics.com/bin/windows/contrib/3.2/labeling_0.3.zip'
Content type 'application/zip' length 40880 bytes (39 KB)
downloaded 39 KB
trying URL 'https://cran.revolutionanalytics.com/bin/windows/contrib/3.2/plyr_1.8.3.zip'
Content type 'application/zip' length 1114785 bytes (1.1 MB)
downloaded 1.1 MB
trying URL 'https://cran.revolutionanalytics.com/bin/windows/contrib/3.2/digest_0.6.8.zip'
Content type 'application/zip' length 151939 bytes (148 KB)
downloaded 148 KB
trying URL 'https://cran.revolutionanalytics.com/bin/windows/contrib/3.2/gtable_0.1.2.zip'
Content type 'application/zip' length 64140 bytes (62 KB)
downloaded 62 KB
trying URL 'https://cran.revolutionanalytics.com/bin/windows/contrib/3.2/reshape2_1.4.1.zip'
Content type 'application/zip' length 503481 bytes (491 KB)
downloaded 491 KB
trying URL 'https://cran.revolutionanalytics.com/bin/windows/contrib/3.2/scales_0.3.0.zip'
Content type 'application/zip' length 603649 bytes (589 KB)
downloaded 589 KB
trying URL 'https://cran.revolutionanalytics.com/bin/windows/contrib/3.2/proto_0.3-10.zip'
Content type 'application/zip' length 458603 bytes (447 KB)
downloaded 447 KB
trying URL 'https://cran.revolutionanalytics.com/bin/windows/contrib/3.2/ggplot2_1.0.1.zip'
Content type 'application/zip' length 2677225 bytes (2.6 MB)
downloaded 2.6 MB
package ‘stringi’ successfully unpacked and MD5 sums checked
Warning: unable to move temporary installation ‘C:\Program Files\R\R-3.2.2\library\file4b804f971e0f\stringi’ to ‘C:\Program Files\R\R-3.2.2\library\XXXXXXXXsti’
package ‘magrittr’ successfully unpacked and MD5 sums checked
package ‘colorspace’ successfully unpacked and MD5 sums checked
package ‘Rcpp’ successfully unpacked and MD5 sums checked
package ‘stringr’ successfully unpacked and MD5 sums checked
package ‘RColorBrewer’ successfully unpacked and MD5 sums checked
package ‘dichromat’ successfully unpacked and MD5 sums checked
package ‘munsell’ successfully unpacked and MD5 sums checked
package ‘labeling’ successfully unpacked and MD5 sums checked
package ‘plyr’ successfully unpacked and MD5 sums checked
package ‘digest’ successfully unpacked and MD5 sums checked
package ‘gtable’ successfully unpacked and MD5 sums checked
package ‘reshape2’ successfully unpacked and MD5 sums checked
package ‘scales’ successfully unpacked and MD5 sums checked
package ‘proto’ successfully unpacked and MD5 sums checked
package ‘ggplot2’ successfully unpacked and MD5 sums checked
The downloaded binary packages are in
C:\Users\Jayaram\AppData\Local\Temp\XXXXXXXX\downloaded_packages
>
Now if you run the command
>library()
You will see that ggplot2 is now in the installed list as shown.
Graphics_03.png
To know more about ggplot2 go
here.
Good luck with data visualization!


