Sunday, December 31, 2017

What do you need to use a map on Universal Windows App?

The application you are writing must be authenticated before the MapControl and the services that needed, the map services in the Windows.Services.Maps.

You need a maps authentication key from the Bing Maps Developer Center in a similar way that you need a key for using Maps on Google applications.

First click on this link to go to the Bing Maps Developer Center.
https://www.bingmapsportal.com

You may need to authenticate yourself with one of the available services, I usually go with Microsoft account. Enter your credentials and sign in and choose to associate that account with Bing Maps Account.


Proceed to create a new key(if you do not have one) using the CreateKey form
Complete Create key


Under My account menu, click My Keys,

The key is user specific and has been masked in the above.


Saturday, December 30, 2017

Show me how to write R Code for Hello World web page?

 R language is open source with a huge number of developers. It has a great arsenal of great stuff already accomplished. It is a language that you should get exposed to yourself. You just install R Gui and you are ready.


Shiny is an enterprise-grade web application framework targeted for those who want to develop with R using the familiar HTML5, CSS and JavaScript. Using R you can turn terrific analytic solutions you have developed/developing into interactive web applications.

Go to this site (https://shiny.rstudio.com/) directly and learn more.

 
Rshiny-00

If you have R Studio you have Shiny because Shiny is a package that you can download.

In this first part we only talk about the very basics.

I assume you have read my previous hands-on R examples in my blogs.


Here I just show a very basic (aka Hello World) example of creating content for a web page using R GUI. More will come later in my blogs.

Launch R Gui as shown and provide reference to the shiny "library" as shown by typing in the three lines of code (The four lines of code in red).


 HelloWorld_00

When you hit Enter after the third line where you define the shiny app, a browser window will open as shown displaying the apps output as shown at a port of the local host.


HelloWorld_01

You also get a response (the last line) in the R GUI as shown.


HelloWorld_02
That is all there is to create a content.

The ui summarizes your user interface, the server is something like a web server and shinyApp is your web response. No fuss, very simple.

How do I configure a BUTTON in XAML?

XAML is a XML based language that Microsoft developed to create a applications the easy way. XAML is declarative that means that whatever you declare up front is what you get. There is no more secret to it.

Universal Windows Projects use this language to build applications.

In this slideshow I show a step-by-step procedure to create an application with XAML which has just a button that displays Hello. It has some color and size to it. Although you will be seeing 18 or more slides once you grasp the spirit, you would do it under a minute.

In order to work with XAML you need Visual Studio 2017 Community. The good news is it is free. What is more BLEND, its comprehensive designer is also installed at the same time. You may also need Windows SDK for Windows 10 which can be found on the Internet. There are various versions.

In developing on Windows Platform be sure to use the intellisense feature that takes out all the mystery and gives you a very practical and intelligent way to work with design.

In this slideshow I show a step-by-step procedure to create an application with XAML which has just a button that displays Hello. It has some color and size to it. Although you will be seeing 18 or more slides once you grasp the spirit, you would do it under a minute.

So let us get on with this slideshow.


Tuesday, December 26, 2017

Do I have hardware compatibility problem to run Hyper-V ?

There are several requirements for Hyper-V compatibility some of which can be enabled in the system BIOS. The two main items are:

  • Virtualization Technology - may have a different label depending on motherboard manufacturer.
  • Hardware Enforced Data Execution Prevention.

This question came up when the Windows Emulator after installation did not appear and a message was shown as to the error:

" Unable to start because hyper visor is not running because hardware virtualization is not enabled."


It was strange because Hyper-V was enabled and working as shown.


Hyper_V_OK.png


To see all requirements for running Hyper-V I ran systeminfo command in the command processor in elevated mode and looks like everything is OK.


The problem lies elsewhere.

Saturday, December 23, 2017

Merry Christmas 2017

Aloha


Hope to post more in coming years....

Keep fit and look forward to great things.

Mahalo

Friday, December 22, 2017

Can you create a new web IIS site on your computer using PowerShell?

Yes you can. PowerShell is indeed powerful. In order to create a new web site you need to import the webadministration module using this import-module statement. However, you should launch Powershell with administrator privileges.

Import-Module webadministration

After running the above and if there are no errors run the following statement to create a new website (TestSite)is this:

New-WebSite -Name TestSite -Port 80 -HostHeader TestSite -Physical Path "$env:systemdrive\inetpub\testsite"

This will spawn an error, if the folder testsite does not exist in the inetpub directory. Create the folder first and then run the New-Website command as above.
----------
New-WebSite : Parameter 'PhysicalPath' should point to existing path.
At line:3 char:1
+ New-WebSite -Name TestSite -Port 80 -HostHeader TestSite -PhysicalPat ...
+ ~~~~~~~~~~~~~~~~~~~~~~~~~~~~~~~~~~~~~~~~~~~~~~~~~~~~~~~~~~~~~~~~~~~~~
    + CategoryInfo          : NotSpecified: (:) [New-Website], ArgumentException
    + FullyQualifiedErrorId : System.ArgumentException,Microsoft.IIs.PowerShell.Provider.NewWebsiteCommand

---------------------------
You can verify the TestSite you created in IIS Manager as shown.


IIS_TestSite

What is tidyverse package?

Tidyverse.org defines itself as an 'opinionated collection of R Packages'. This is a modest statment as tidyverse can do a lot of things.

Tidyverse is specialized group of packages for data science.  If you are familair with ggplot2, the most popular data visualizing packgage in R universe, then it is included in tidyverse in addition to more useful packages.

The 'Core' package consists of many useful packages but you can also bring in others in the package to work with it to enhance its usability above and beyond what it can do by itself.

Here are what you find in the core of tidyverse.


These are loaded when you load tidyverse. There are packages in tidyverse that you have to load separately using the library() such as:
readxl .xls and .xlsx
haven for SPSS, Stata and SAS data
jsonlite
xml2
httr
rvest
DBI
and many others.

How do you install SQL Server Reporting Services 2017?

Prior to SQL Server 2017, there was an option to include SQL Server Reportign Services during SQL Server Installation. This has changed.

If you have reviewed my previous post related to Installing SQL Server 2017 Devvelopment edition you would have noticed the absence of anything related to SQL Server Reporting Services 2017. This is by design.

In SQL Server 2017, you need to install SSRS 2017 separately. The installer file itself is veyr small about 100 MB. There are three advantages by using the new installer:
  • If you have installed SQL Server 2017 Database engine, it just takes a shortwhile to install SSRS 2017
  • Update SSRS 2017 very quickly
  • The installer is stand-alone withot bringing other programs in, yu can always install the latest version without impacting your SQL Server databases or other features.
Download SSRS 2017 from here:

Thursday, December 21, 2017

What is Windows IP over USB?

It is a Windows Service that you find in Control Panel...Services window. It is needed to be running if you are developing for Windows Phone.

It enables communication between the Windows SDK and a Windows Device. If the service is stopped, application deployment and debugging will fail on the device.

If it is not started, you should start it from the Control Panel. When it is running you should see the process in the Windows Task Manager.


You can start and stop the service in the above Services screen in Windows.


Wednesday, December 20, 2017

How do you check if your computer supports Second Level Address Translation?


Second Level Address Translation (SLAT), also known as nested paging, is a hardware-assisted virtualization technology which makes it possible to avoid the overhead associated with software-managed shadow page tables.
Intel's implementation of SLAT is known as Extended Page Table and is available for Intel Core i7, Core i5 and Core i3 procesors.
The computer used here is Windows 10 Pro from DELL and seems to have Core i7.
How do you check if the machine is SLAT capable?
You download this tool from CodePlex.
MachineSLATStatusCheck from here:

http://slatstatuscheck.codeplex.com/

You get a zipped EXE file; CheckSLATStatusOfMachine.exe (6.45KB)
Extract it and run and click check and immediately you get a response as shown (for this Dell machine).


SLATCheck

How do you create apps for SQL Server

This is a very useful site that you should acquaint yourself with. You can create apps that work with SQL Server with all of the following:

C#
Java
NodeJS
PHP
Python

on

Windows
macOS
RHEL
UBUNTU
SLES (Suse...)


You need to start at this link:

Tuesday, December 19, 2017

Can you import Arabic characters into a table using R?

I tried this simple example. I do not know Arabic but I created this 3x2 table and tried to get it into a variable in R. Looks like I succeeded. I think these are
Unicode (https://unicode-table.com/en/search/?q=U%2B0648) characters for the Arabic characters.

Now I request my Arabic readers to help me if this makes sense.


The first row translates to the following:


You may reply to: hodentek@live.com

How do I access individual table cells in a table.read() in R?

Once you have read data into R using table.read() as described here, you can also access each of the cells in the 9 element grid of the 3 columns X 3 rows by providing row and column numbers.

You defined the table as shown here:


You can access row1, column 1 using this code:
-----------
> df[1, "Col1"]
[1] A
-----------
Using code similar to the above you can access each element providing row number and column number as shown.

df[1, Col1]   df[1, "Col2"]   df[1, "Col3"]
df[2, Col1]   df[2, "Col2"]   df[2, "Col3"]
df[3, Col1]   df[3, "Col2"]   df[3, "Col3"]

Monday, December 18, 2017

How do you store the values of a table with three columns or more columns in R?

Let us say you want to work this table in R.
Table with three columns
Col1 Col2  Col3AA
A      50      40
B      70      60
C      25      75

In a previous post we described another way.

You can also directly assign the table using the tabel.read() as shown:

You could directly enter the text as shown:
--------------------
<- br="" header="TRUE," read.table="" text="<br>+ Col1   Col2   Col3<br>+ A      50     40<br>+ B      70     60<br>+ C      25     75<br>+ ">
--------------------
Note that while typing the text of your data, you need to put in the white spaces yourself. You cannot just copy the table shown earlier (Table with three columns) and paste it. The R Editor takes away the white spaces.
<- br="" header="TRUE," read.table="" text="<br>+ Col1   Col2   Col3<br>+ A      50     40<br>+ B      70     60<br>+ C      25     75<br>+ ">

Sunday, December 17, 2017

How do you draw a bar graph from a table of X,Y values?

In a previous post you saw how to create a data frame in R using a set off x and y values as shown:

  x      ItmVal
1 A     69
2 B     47
3 C     11
4 D     12
5 E     42
6 F     24


Here 1 to six are line numbers.

It is easy to draw a bar graph using this data:
------
>  dap <- br="" data.frame="">+  x=factor(c("A","B","C","D","E","F"), levels=c("A","B","C","D","E","F")),
+ ItmVal=c(69,47,11,12,42,24)
+ )
-----------
You map the data to aesthetics as shown and you can display your graph as shown.


ggplot-bargraph1

On the other hand if you want a different color for each of the different x values you could use this:


ggplot_bargraph2

What is Linius Video Virtualization?

Video content need not be a black-box containing the various stuff that go into video like, images, audio, etc. Video Virtualization takes your video file and converts it into another file where the individual pieces in the original video can be edited.

Microsoft, Amazon and IBM are investing in Video Virtualization. Microsoft with the help of Magenic is making Video Virtualization available on Microsoft Azure.

Here is a video that explains Video Virtualization of Linius.


Linius has perfected Video Virtualization protected by patents that all the three previously mentioned cloud companies are using (going to use?).

This is serious stuff as most user experience these days are driven by videos, be it entertainment, news or anything else. Being a single technical source, Linius will profit hugely.

I was driven by curiosity and wanted to see how far I can go in creating a Virtual Video file using Linius Video Virtualization Engine (VVE). I did get to the part of bringing in my video file here:

---------------------------------
Video created to describe a visit to Amalfi in Italy. https://youtu.be/xF1o0uJlk_I

I was able to get this file into VVE at this site: http://VVEplay.com/


When I tried to edit, the software broke my file (which was actually a slide-show) into attached individual frames for each slide. There were no controls in Step 2 where you can edit. Anyway, I published it after the second step and it produced another file at the VVE site.


Now I am not sure how to go from here to edit this '186490283' file. The above produced an error on a web page.

Some of my unanswered questions are:
Do I need to get to the file on VVE site to edit it?
How do I edit it? Graphic User Interface? If Programmatic, how?
How do I use its features, Search, modifying content, introduce ads, etc.?

Friday, December 15, 2017

How do I ‌put x and y values as data input in R programming?

In constructing relationship between x and y, we create a table with two columns, with x in the first column and corresponding y in the second column. The value of x may be discrete (numeric or non-numeric) or continuous(numeric) and y is numeric. A graph with x and y represents the table of values.
In the following there are six categories (A through F) and for each of these categories a value has been assigned (67,47,11,12,22,24). Now how do I create a data in R that I could work on?
This is easily carried out by creating a data frame as shown:

> dap <- br="" data.frame="">+  x=factor(c("A","B","C","D","E","F"), levels=c("A","B","C","D","E","F")),
+ ItmVal=c(69,47,11,12,42,24)
-----------------------------------


DataFrameDiscrete.png

What is the best program to review report rdl file?

A RDL file is a report definition language (RDL) file. It has every bit of information in the file.

You have several options to look at a report's rdl file as shown (by right clicking the (any report) reportany.rdl file.


XmlRdl_0


You could open in Notepad and it is going to be a very large file and you may get yourself lost in it without recognizing the key areas. Even using Microsoft Edge it is the same. You could open in Microsoft Visual Studio, but not every one may have it.
The reccommendation is XML Notepad. This is a good application to review the properties of a report rdl file.
You may download XML Notepad as described here. it is free.
Launch XML Notepad and click FIle menu to open the rdl file. In this case I am using a simple file called SimpleReport.rdl.
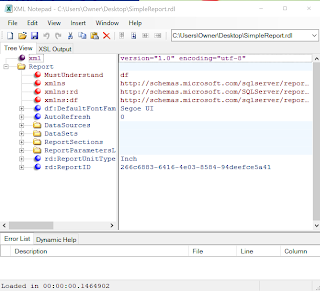
The file gets opened as shown. Now you see why I recommend this application. You canveyr clearly see how ggthe report is constructed.


XmlRdl_1.png

Expand the DataSource to see the details.


XmlRdl_2.png

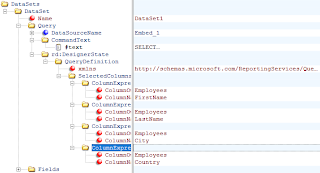
Now open the DataSets node as shown.


XmlRdl_3.png

Click the Fields to see the fields in the data as shown.

XmlRdl_4.rdl


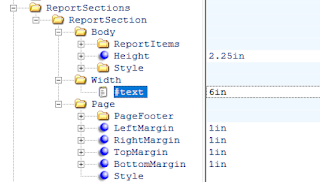
Well, you can also see the report design.

XmlRdl_5.rdl

Explore more and enjoy!

I guess you agree with my assertion that XML Notepad is the best to see the report rdl file.

Thursday, December 14, 2017

How do you use factor/s in R Programming?

Factors are variables to represent categories. Categories are discrete and not continuous. In statistics there is a need for such a variable.

Let us say, I roll the dice a dozen times and come up with values for each roll as shown:
2,4,5,3,2,6,10,5, 9,6,4,5

I can gather these in a data as shown in R with "dat":
data
---------------------------------


---------------------------------
Now I use 'factor' as used in R:
facData=factor(data)
--------------------

-----------------------
factor just took one unique item from the list presented to it to display in Levels. There were two 4's, three 5's and two 6's. It categorized them.

While the original data was numeric they could be also character data in "datac" below:


-------------------------------
We know the unique ones in the above data. How are we going to find how many of each are there?
For this we can use the table() in R as shown below:
------------------------------------

You can check for yourself, that it picked the correct value for each category.