We have seen earlier how to install PIL and OpenCV to visualize images. Matplotlib is yet another library for creating complex plots and graphs.
Each of these graphic libraries have their own application area:
PIL(Pillow): Great for simple manipulations like cropping, resizing and adding filters. Easy to use but not for extensive visualizations.
OpenCV: Great for real-time computer vision tasks and image processing and lend itself to feature detection, object recognition and video analysis.
Matplotlib: Great for complex plots, graphs, and charts. Highly customizable.
Installing Matplotlib
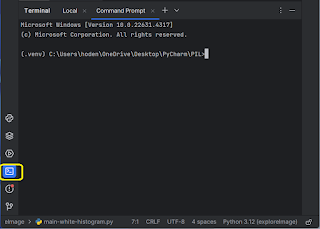
Herein, I consider installing matplotlib in the PyCharm IDE that was used for PIL and OpenCV. You can use either the python interpreter to install the library package or the virtual terminal.
In the PyCharm IDE locate the Packages icon highlighted in blue. You can see other packages from earlier installs like pip, pillow, etc.
Type in the following : pip install matplotlib
This should install matplotlib. The program came back saying that it is already present in the site packages.
------------
(.venv) C:\Users\hoden\OneDrive\Desktop\PyCharm\PIL>pip install matplotlib
Requirement already satisfied: matplotlib in c:\users\hoden\pycharmprojects\exploreimage\.venv\lib\site-packages (3.9.2)Requirement already satisfied: contourpy>=1.0.1 in c:\users\hoden\pycharmprojects\exploreimage\.venv\lib\site-packages (from matplotlib) (1.3.0)Requirement already satisfied: cycler>=0.10 in c:\users\hoden\pycharmprojects\exploreimage\.venv\lib\site-packages (from matplotlib) (0.12.1)Requirement already satisfied: fonttools>=4.22.0 in c:\users\hoden\pycharmprojects\exploreimage\.venv\lib\site-packages (from matplotlib) (4.54.1)Requirement already satisfied: kiwisolver>=1.3.1 in c:\users\hoden\pycharmprojects\exploreimage\.venv\lib\site-packages (from matplotlib) (1.4.7)Requirement already satisfied: numpy>=1.23 in c:\users\hoden\pycharmprojects\exploreimage\.venv\lib\site-packages (from matplotlib) (2.1.1)Requirement already satisfied: packaging>=20.0 in c:\users\hoden\pycharmprojects\exploreimage\.venv\lib\site-packages (from matplotlib) (24.1)Requirement already satisfied: pillow>=8 in c:\users\hoden\pycharmprojects\exploreimage\.venv\lib\site-packages (from matplotlib) (10.4.0)Requirement already satisfied: pyparsing>=2.3.1 in c:\users\hoden\pycharmprojects\exploreimage\.venv\lib\site-packages (from matplotlib) (3.2.0)Requirement already satisfied: python-dateutil>=2.7 in c:\users\hoden\pycharmprojects\exploreimage\.venv\lib\site-packages (from matplotlib) (2.9.0.post0) Requirement already satisfied: six>=1.5 in c:\users\hoden\pycharmprojects\exploreimage\.venv\lib\site-packages (from python-dateutil>=2.7->matplotlib) (1.16.0)[notice] A new release of pip is available: 23.2.1 -> 24.3.1[notice] To update, run: C:\Users\hoden\PycharmProjects\exploreImage\.venv\Scripts\python.exe -m pip install --upgrade pi
And, indeed it was. The reason for this is perhaps the project files are not in the virtual environment.
Anyway, before you use matplotlib in your python project, you need to import the plotting routine using
Import matplotlib.pyplot as plt
Usage of matplotlib
Python code for displaying an image.
We will use the same RGB.png image as in the earlier posts.
----------------
import matplotlib.pyplot as plt
import matplotlib.image as mpimg

# Load the image
image = mpimg.imread(r'C:\Users\hoden\PycharmProjects\exploreImage\Images_2\RGB.png')
# Display the image
plt.imshow(image)
plt.axis('off')
# Hide axes for a cleaner look
plt.title('Displayed Image')
plt.show()
----------------
The following image gets displayed:
Matplotlib uses a backend to display images and plots. The backend is responsible for rendering the visualizations to the screen or saving them to a file. By default, Matplotlib selects the appropriate backend based on your environment. Some common backends are:
TkAgg: Uses the Tkinter library for rendering.
Qt5Agg: Uses the Qt5 library for rendering.
MacOSX: Used for rendering on macOS.
GTK3Agg: Uses the GTK3 library for rendering.
Agg: Used for rendering to files without displaying on screen.
How to check the display device used for rendering:
The following code is used to check the display device:
Import matplotlibprint(matplotlib.get_backend())On my Windows 11 laptop, it appears to use the TkAgg library for rendering as I get a reply 'tkagg' for the above code.


No comments:
Post a Comment