This appears to be a new thing that Excel is supposed to do. It is really
Business Analysis, and I was just curious to see how much intelligence can
be gathered and how interactive the application. It uses the GET and TRANSFORM
features of EXCEL. Get started with Power Pivot to reap the benefits.
This program came with my Office 365 subscription and I was encouraged to
take the tour. Here are some images of my tour. It only worked partially. When
I added a third stock symbol, it could not come up with an anticipated response.
I think it is still in the works! More can be found on Excel Team blog.
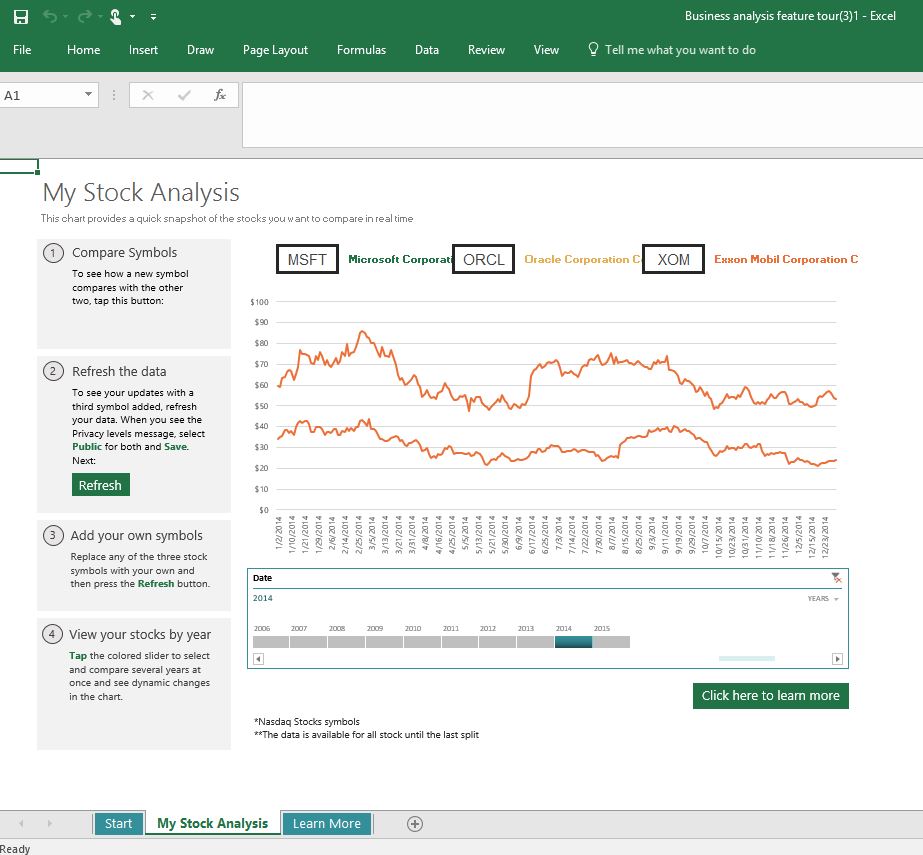
This is what you would see after launching EXCEL2016 from its shortcut.


 Click My Stock Analysis. It comes up with a two default stocks, their performance over a number of years as well as a chart. The application is supposed to allow you enter one more NASDAQ stock.
 I tried a couple of them like XOM, AAPL, GOOGL, etc. It asks for privacy information as shown in the next. For both option choose, PUBLIC and it should allow the third stock to enter


Business Analysis, and I was just curious to see how much intelligence can
be gathered and how interactive the application. It uses the GET and TRANSFORM
features of EXCEL. Get started with Power Pivot to reap the benefits.
This program came with my Office 365 subscription and I was encouraged to
take the tour. Here are some images of my tour. It only worked partially. When
I added a third stock symbol, it could not come up with an anticipated response.
I think it is still in the works! More can be found on Excel Team blog.
This is what you would see after launching EXCEL2016 from its shortcut.

Click on Stock Analysis

Click Create.


I could change the default stocks but the third stock did not work as expected. The charts, I suppose is no more relevant.
As I said earlier, it is still in works. It could become a great tool in the future.
No comments:
Post a Comment